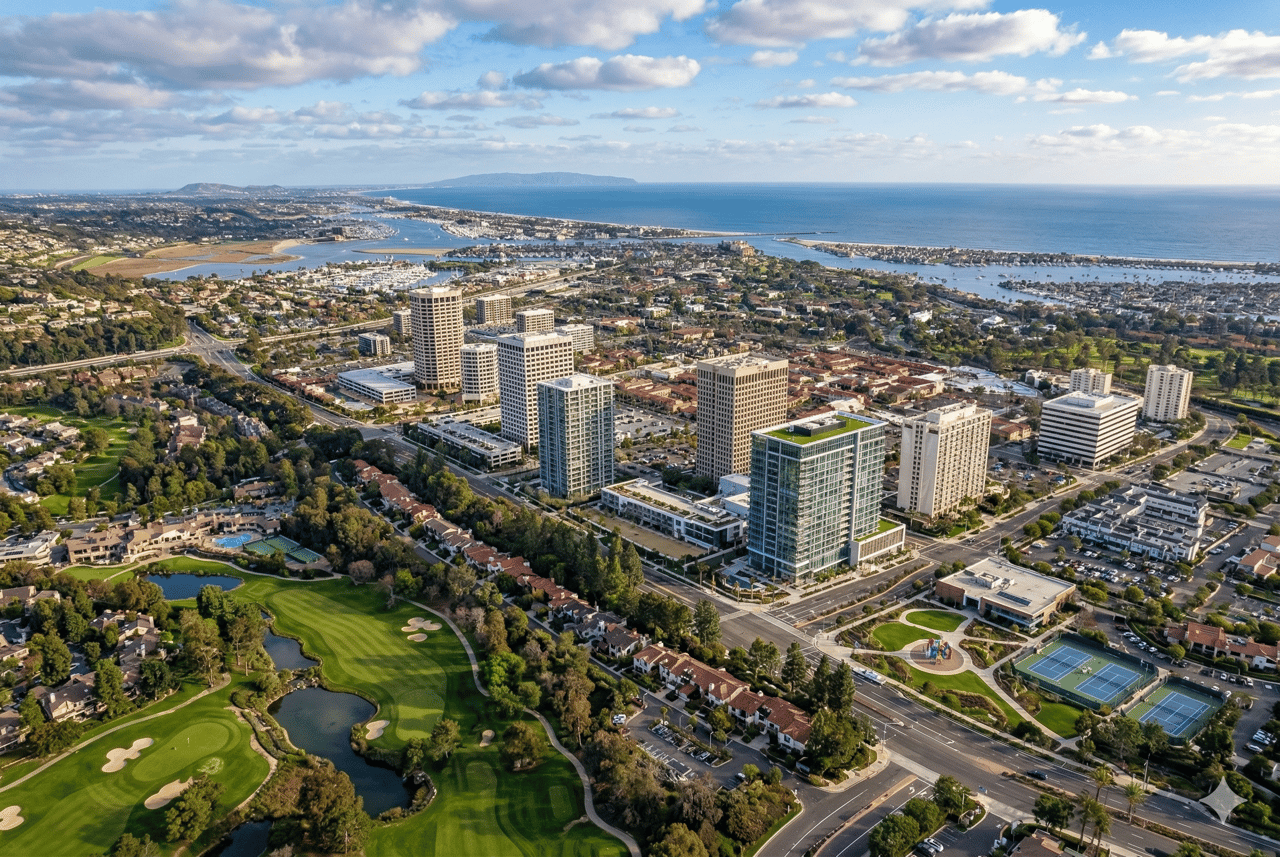
If you look at Newport Beach market data the same way you would look at a typical suburban market, you can miss what actually drives value here. This is a market where citywide averages only tell part of the story, and where pricing, liquidity, and return potential can shift sharply from one micro-area to the next. If you want to buy or sell with an investor mindset, the key is knowing which numbers matter most and how to read them in context. Let’s dive in.
Start With the Citywide Snapshot
At a high level, Newport Beach is a luxury market with relatively low turnover and low rental yield. Redfin reports a median sale price of $3.55 million, median price per square foot of $1.47K, 55 median days on market, and a 96.7% sale-to-list ratio. On the listing side, Realtor.com shows a $4.80 million median listing price, $1.73K median listing price per square foot, 454 active listings, 50 median days on market, and a 97% sale-to-list ratio.
That combination matters. It suggests a market where sellers still hold meaningful pricing power, but buyers are also selective. Realtor.com classifies Newport Beach as a balanced market, while Orange County overall trends more toward a seller’s market.
For investors, this usually points to a market driven less by immediate cash flow and more by scarcity, long-term wealth preservation, and location-specific demand. Census QuickFacts also shows a median household income of $156,867 and owner-occupied housing value of $2,000,000+, which helps explain why many buyers here are not making decisions based only on yield.
Why Citywide Medians Can Mislead You
A citywide median can be useful as a starting point, but it is not enough to underwrite a deal in Newport Beach. This market behaves more like a collection of distinct luxury submarkets than one uniform market. If you compare a property in Big Canyon to one in Crystal Cove or Balboa Peninsula Point, you are often comparing very different pricing logic and exit profiles.
That is why an investor-style read starts with the citywide snapshot, then quickly narrows to the neighborhood and product type. In Newport Beach, price per square foot, days on market, and rent-to-price ratios can vary dramatically by micro-area.
Watch Price Per Square Foot by Micro-Area
One of the clearest investor signals in Newport Beach is the spread in asking price per square foot across neighborhoods. According to Realtor.com’s Newport Beach market data, Crystal Cove is listed around $3,573 per square foot, Balboa Peninsula Point around $2,590, West Newport Beach around $2,439, Corona del Mar around $2,155, and Central Newport Beach around $2,117. Newport Coast is around $1,732, Mariners around $1,579, Newport Heights around $1,497, and Big Canyon around $1,321.
That spread tells you something important. Buyers are not valuing Newport Beach as one market. They are valuing specific locations, property types, view corridors, lot characteristics, and scarcity.
Recent sold data from Redfin neighborhood pages reinforces that point. Irvine Terrace shows sold pricing around $2.26K per square foot with 22 days on market, Newport Coast around $2.23K with 25 days, Crystal Cove around $2.76K with 47 days, West Newport Beach around $1.81K with 81 days, Newport Heights around $1.26K with 66 days, and Big Canyon around $903 with 109 days.
The takeaway is simple: you should price and evaluate Newport Beach real estate by micro-area first, citywide median second. For both buyers and sellers, that can lead to much better decision-making.
Compare Listing Data and Sold Data Together
One of the most useful habits for reading this market like an investor is separating listing data from sold data. Listing data tells you what sellers hope to get. Sold data tells you what buyers have actually been willing to pay.
That difference is especially important in a luxury market where pricing strategy can vary widely. The research suggests you should use Redfin and Realtor.com together as a range, not treat one number as exact. In practice, that means checking whether a home is positioned reasonably against both current neighborhood competition and recent neighborhood outcomes.
If you are buying, this helps you avoid anchoring too heavily to aspirational asking prices. If you are selling, it helps you set a price that protects value while still matching the liquidity profile of your specific neighborhood.
Understand Absorption and Supply
Market pace matters because it affects negotiation leverage and likely hold time. Based on 73 homes sold and 454 active listings, Newport Beach has a rough monthly absorption rate of about 16.1%, or approximately 6.2 months of supply, using a stock-to-flow heuristic from the research.
That is not the same as an official MLS months-supply figure, but it is still a helpful directional read. It suggests a market that is moving, just not at a speed that supports careless pricing or short-timeline assumptions.
For investors, that means your exit should be underwritten conservatively. For sellers, it means presentation and pricing still matter, even in a high-value market with strong long-term demand.
Newport Beach Is Not a Cash-Flow Market
If you are evaluating Newport Beach strictly on rental yield, the numbers are hard to ignore. Based on Realtor.com data, a median rent of $4,995 per month against a $4.80 million median listing price implies a gross yield of about 1.25%.
That is well below Orange County overall, where the same source shows a rough gross yield closer to 3.14% using a $3,500 median rent and about a $1.34 million median listing price. In other words, Newport Beach generally does not screen as a traditional cash-flow market.
Neighborhood-level asking-price yields show the same pattern. Balboa Peninsula Point is around 3.0%, Corona del Mar around 2.9%, Big Canyon around 2.2%, Central Newport Beach and West Newport Beach around 1.9%, Crystal Cove around 1.8%, and Newport Coast and Mariners around 1.0%.
That does not mean investment logic disappears here. It means the investment thesis often shifts toward scarcity, long-term appreciation, personal use value, or strategic repositioning rather than near-term income.
Underwrite Rent Conservatively
Even when a property has rental potential, conservative underwriting matters. Realtor.com notes that Newport Beach had 706 rental listings, while median rent fell 11.72% year over year and rental inventory rose 4.56%.
That is a useful reminder not to overestimate rent growth or assume that premium pricing automatically produces premium yield. If your ownership costs only work under an aggressive rent scenario, that may be a sign to revisit your assumptions.
For buyers, this is where disciplined underwriting can protect you. For sellers marketing to investor-minded buyers, clear positioning around realistic carrying potential can also help build confidence.
Focus on Liquidity, Not Just Price
A common mistake is to treat Newport Beach as equally liquid across every neighborhood. The citywide median days on market of 50 to 55 days is helpful, but it can hide major differences in how fast homes move.
According to the research, Newport Coast is around 25 days on market, Irvine Terrace 22 days, Balboa Island 38 days, Big Canyon 46 days, Crystal Cove 47 days, Newport Heights 66 days, West Newport Beach 81 days, and Balboa Peninsula Point 91 days.
That range can have a big effect on your strategy. A faster-moving submarket may support a more aggressive acquisition or listing plan. A slower-moving one may require more patience, stronger property differentiation, and more conservative assumptions around carrying costs.
Match the Hold Period to the Thesis
Investor-style thinking also means matching your expected hold period to the reason you are buying. In Newport Beach, that choice should reflect neighborhood liquidity, rental yield, and whether the opportunity is based on appreciation, value-add work, or land value.
A short hold may make more sense when the plan is tied to repositioning, tax timing, or a specific value-add opportunity. A medium hold may fit when the return depends on renovation or neighborhood re-rating. A longer hold often makes more sense when the asset is primarily a scarcity play and the return thesis leans heavily on appreciation.
Because many submarkets still take roughly 1.5 to 3 months to clear and gross yields remain low, the exit should never be treated as automatic. In this market, the right hold period can matter just as much as the entry price.
Three Questions Smart Buyers and Sellers Ask
When you read Newport Beach market data like an investor, three questions tend to matter more than broad headlines:
- Is the property priced correctly for its exact micro-area?
- Does the rent-to-price ratio support ownership if appreciation slows?
- How long do comparable homes take to sell in this specific neighborhood?
Those questions create a more practical framework than trying to predict the entire city. They also help you move from general market awareness to property-level decision-making.
What This Means for You
If you are buying in Newport Beach, the most important shift is to stop thinking in averages. A citywide median may tell you where the market sits broadly, but your real edge comes from understanding the specific neighborhood, the product type, and the likely exit path.
If you are selling, the same principle applies. Your property is not competing with every home in Newport Beach. It is competing with a narrower set of homes in your immediate micro-market, and buyers will compare your pricing, condition, and time-to-sale prospects accordingly.
That is where local, investor-grade analysis becomes valuable. If you want help evaluating a Newport Beach purchase, pricing a listing, or assessing a neighborhood’s true liquidity profile, connect with Tyler Brown & Associates for a private consultation.
FAQs
How should you read Newport Beach market data as an investor?
- Start with citywide trends, then narrow quickly to the exact neighborhood, price per square foot, rental yield, and days on market for comparable properties.
Is Newport Beach a strong cash-flow market for real estate investors?
- Based on the research, Newport Beach is generally a low-yield market where many buyers focus more on scarcity, appreciation, and long-term wealth preservation than immediate cash flow.
Why does price per square foot vary so much across Newport Beach neighborhoods?
- Newport Beach pricing is heavily shaped by micro-area differences, including scarcity, location, property type, and other property-specific factors rather than one citywide pricing pattern.
What does days on market tell you about Newport Beach liquidity?
- Days on market helps you estimate how quickly homes may sell in a given neighborhood, which can shape your negotiating strategy, carrying-cost assumptions, and exit timeline.
Should buyers and sellers use listing data or sold data in Newport Beach?
- You should use both, because listing data shows current seller expectations while sold data shows recent buyer behavior, and together they give a more balanced view of value.
What is the biggest mistake people make when analyzing Newport Beach real estate?
- One of the biggest mistakes is relying too much on citywide averages instead of evaluating the exact micro-market where the property is located.