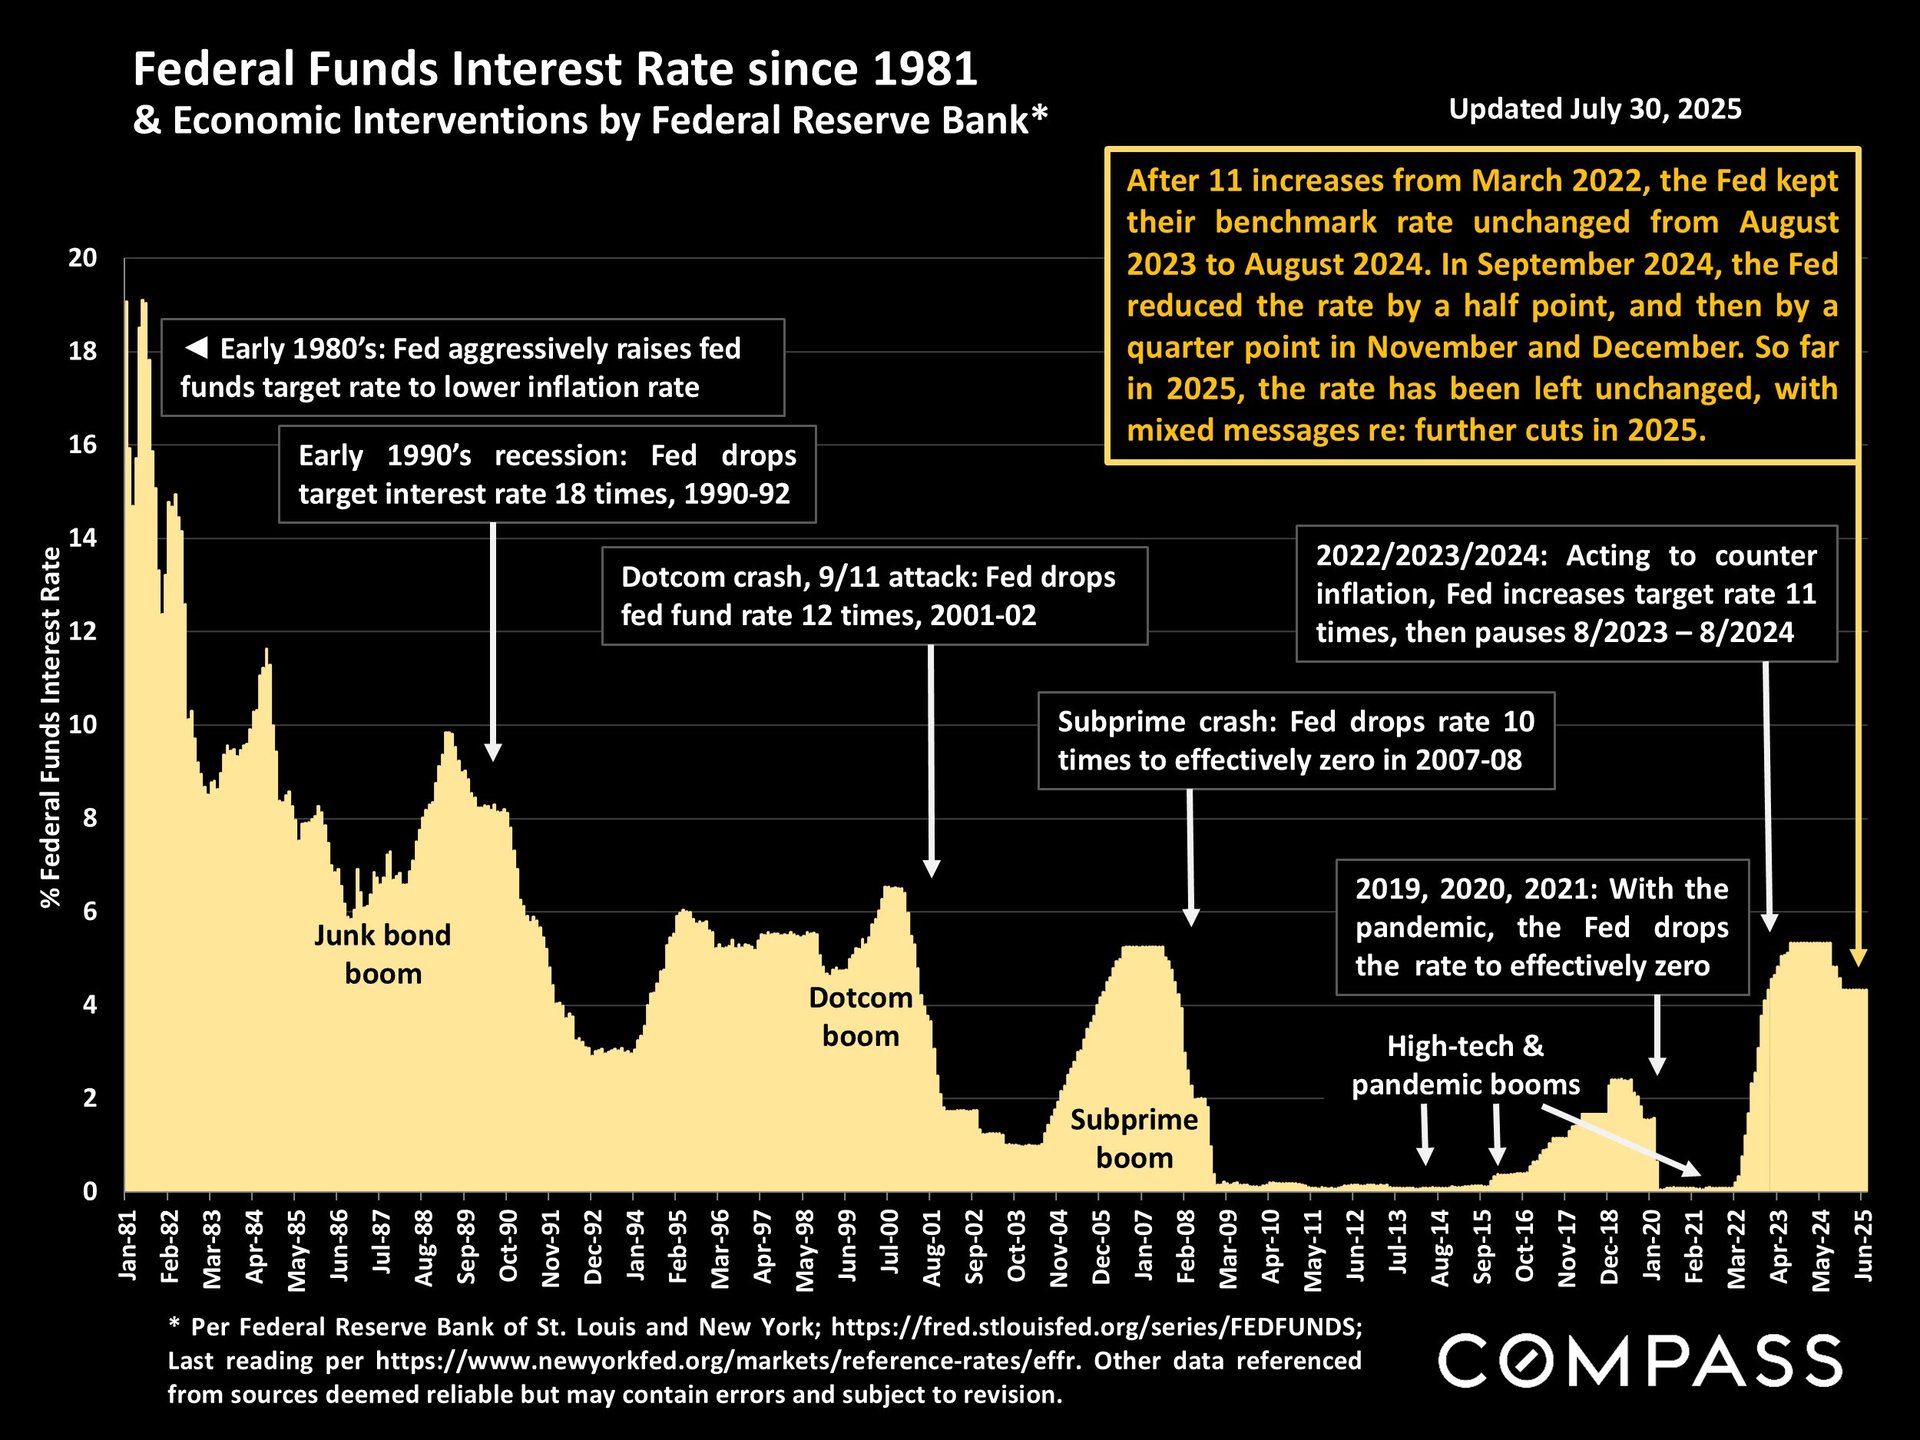
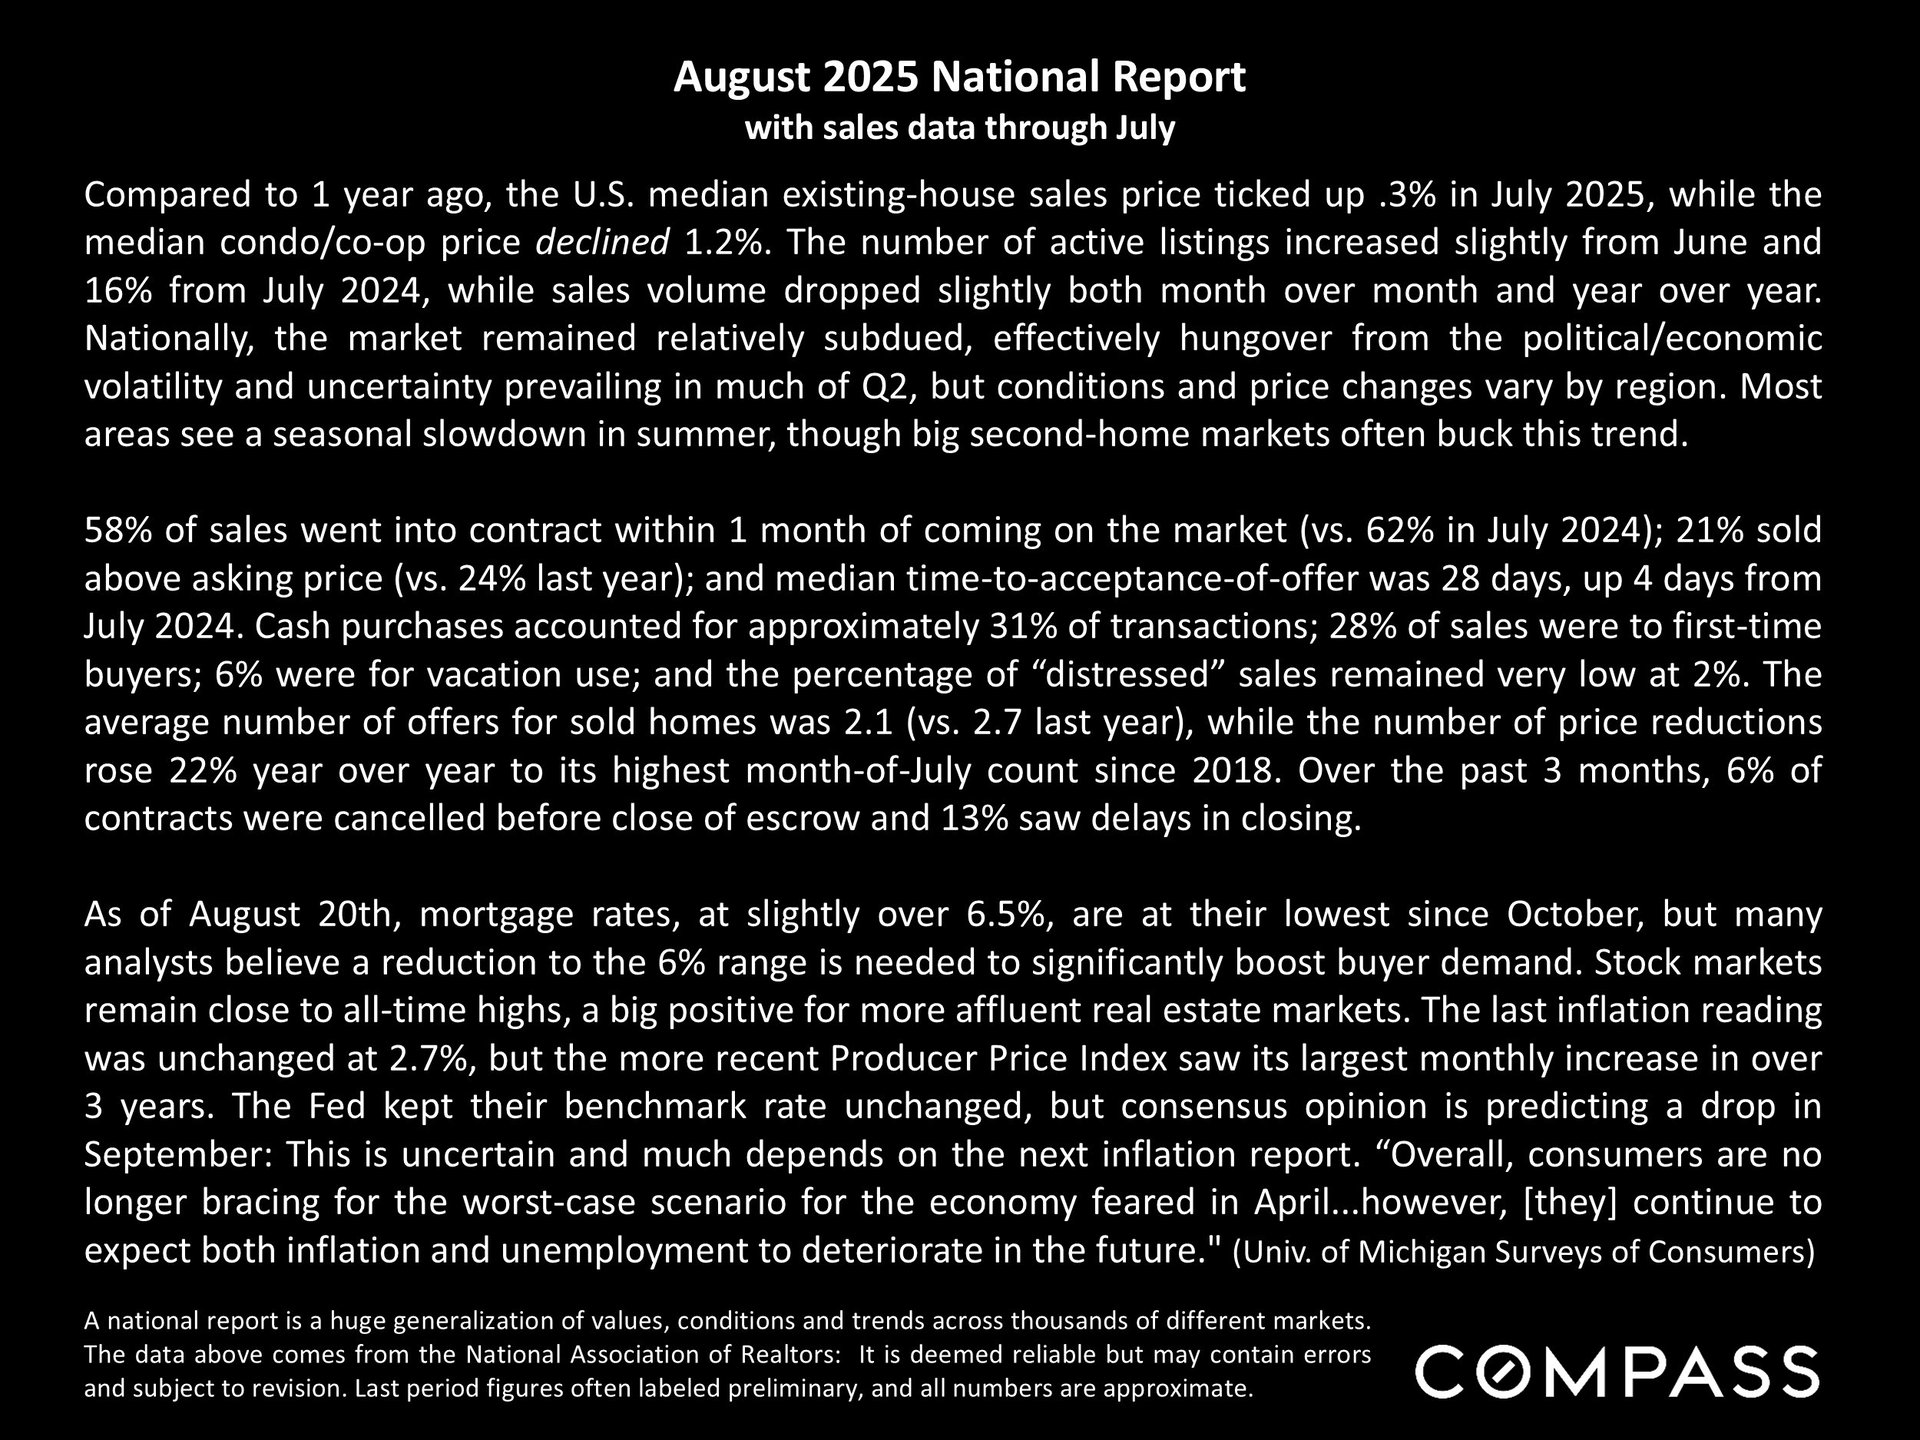
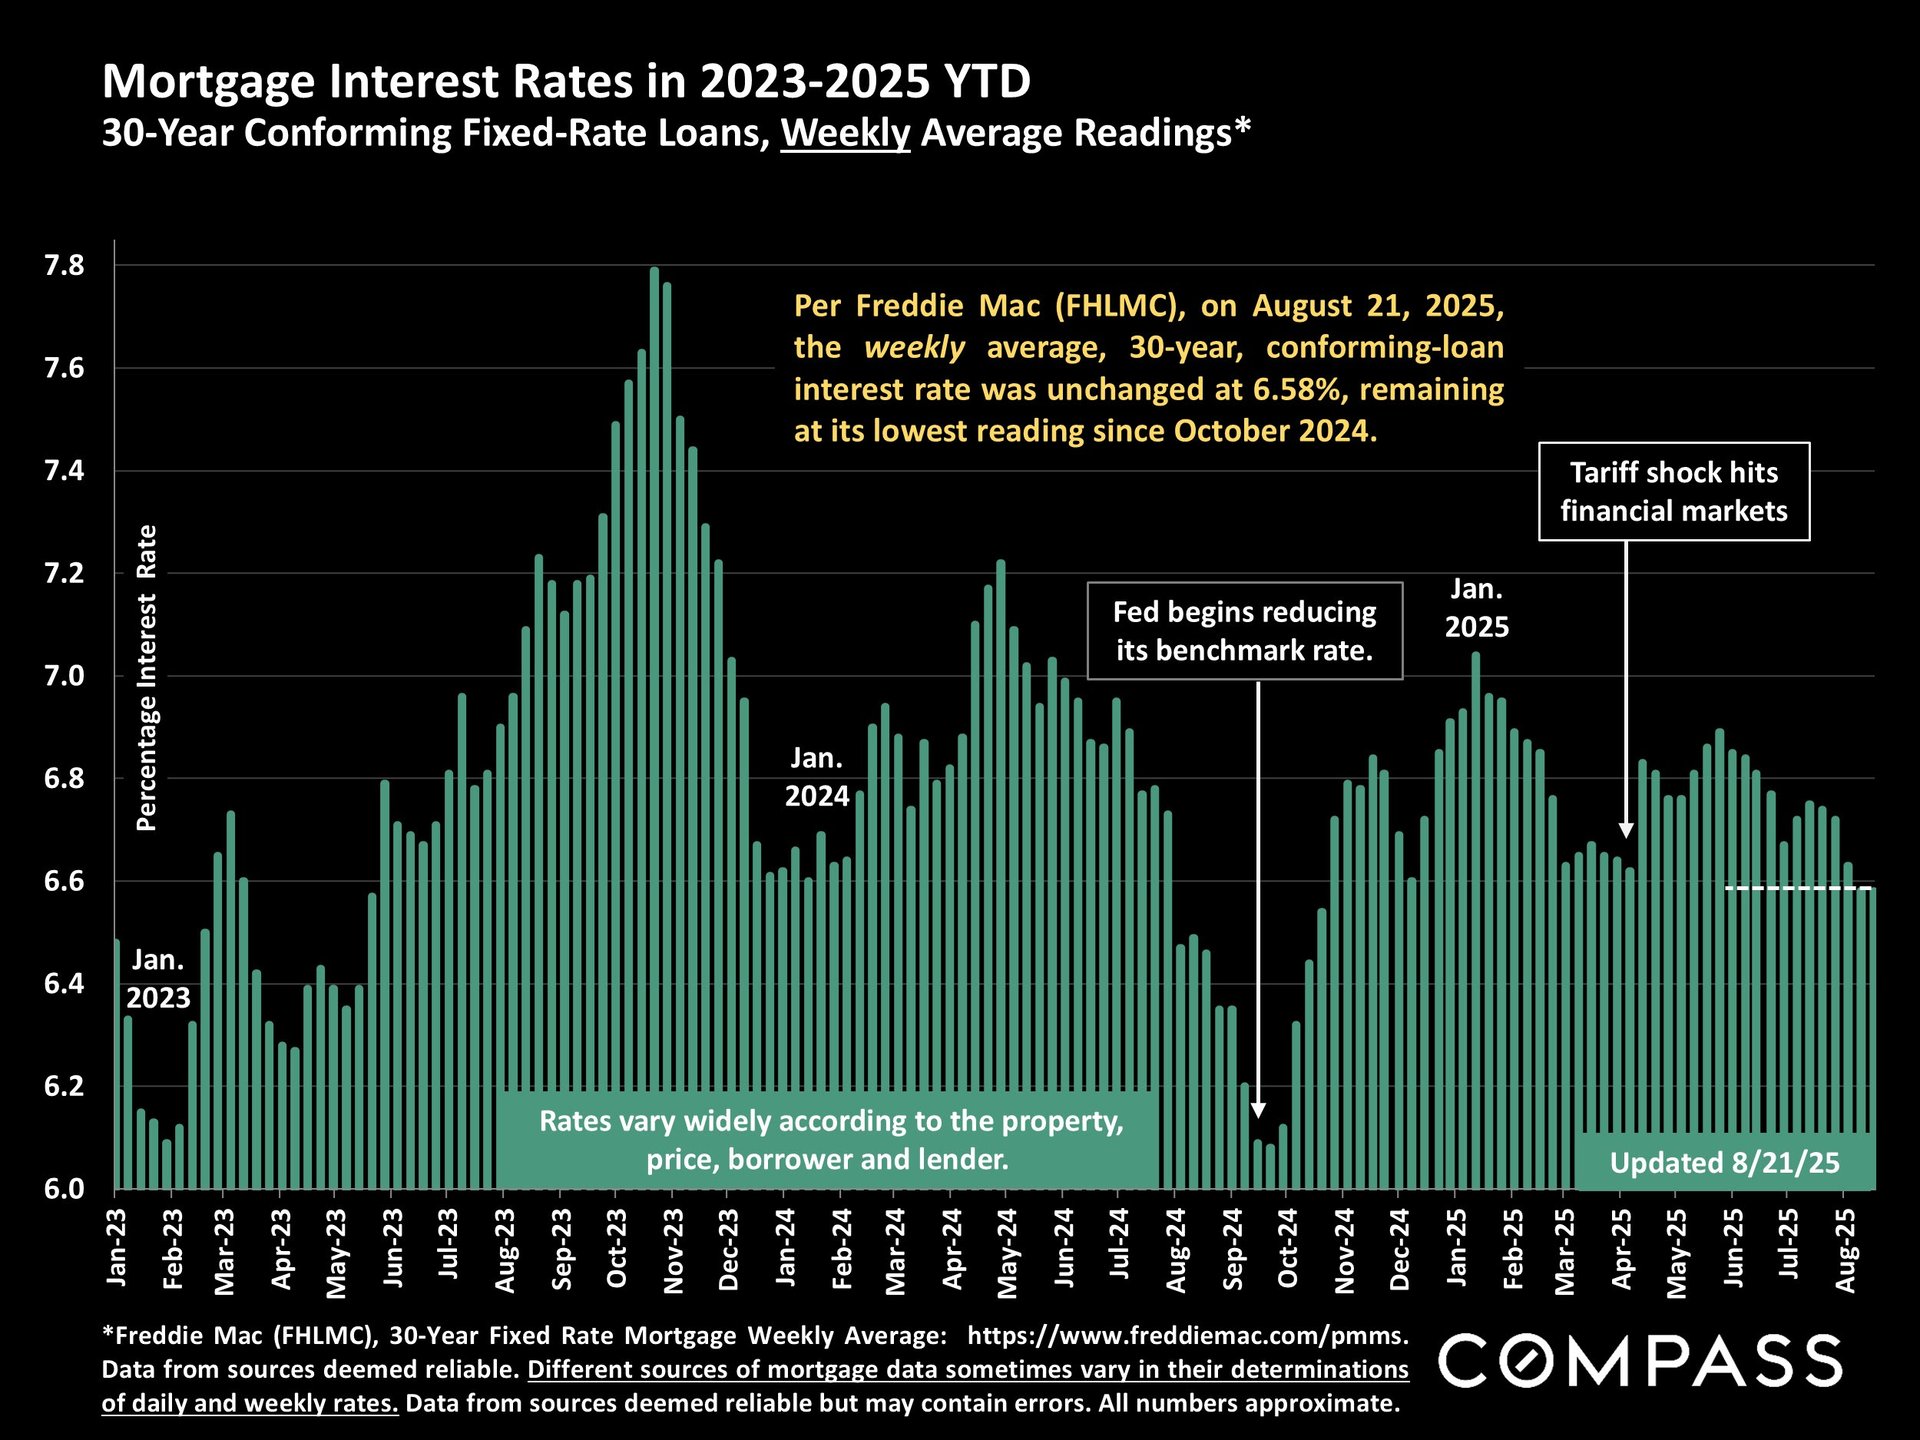
Interest rates are at their lowest point since last October. If the decline continues - especially if they get down to the 6% range - the market may see a substantial rebound in buyer demand this fall. Affordability is a tremendous issue currently, and the quickest improvement would occur with a significant drop in interest rates.
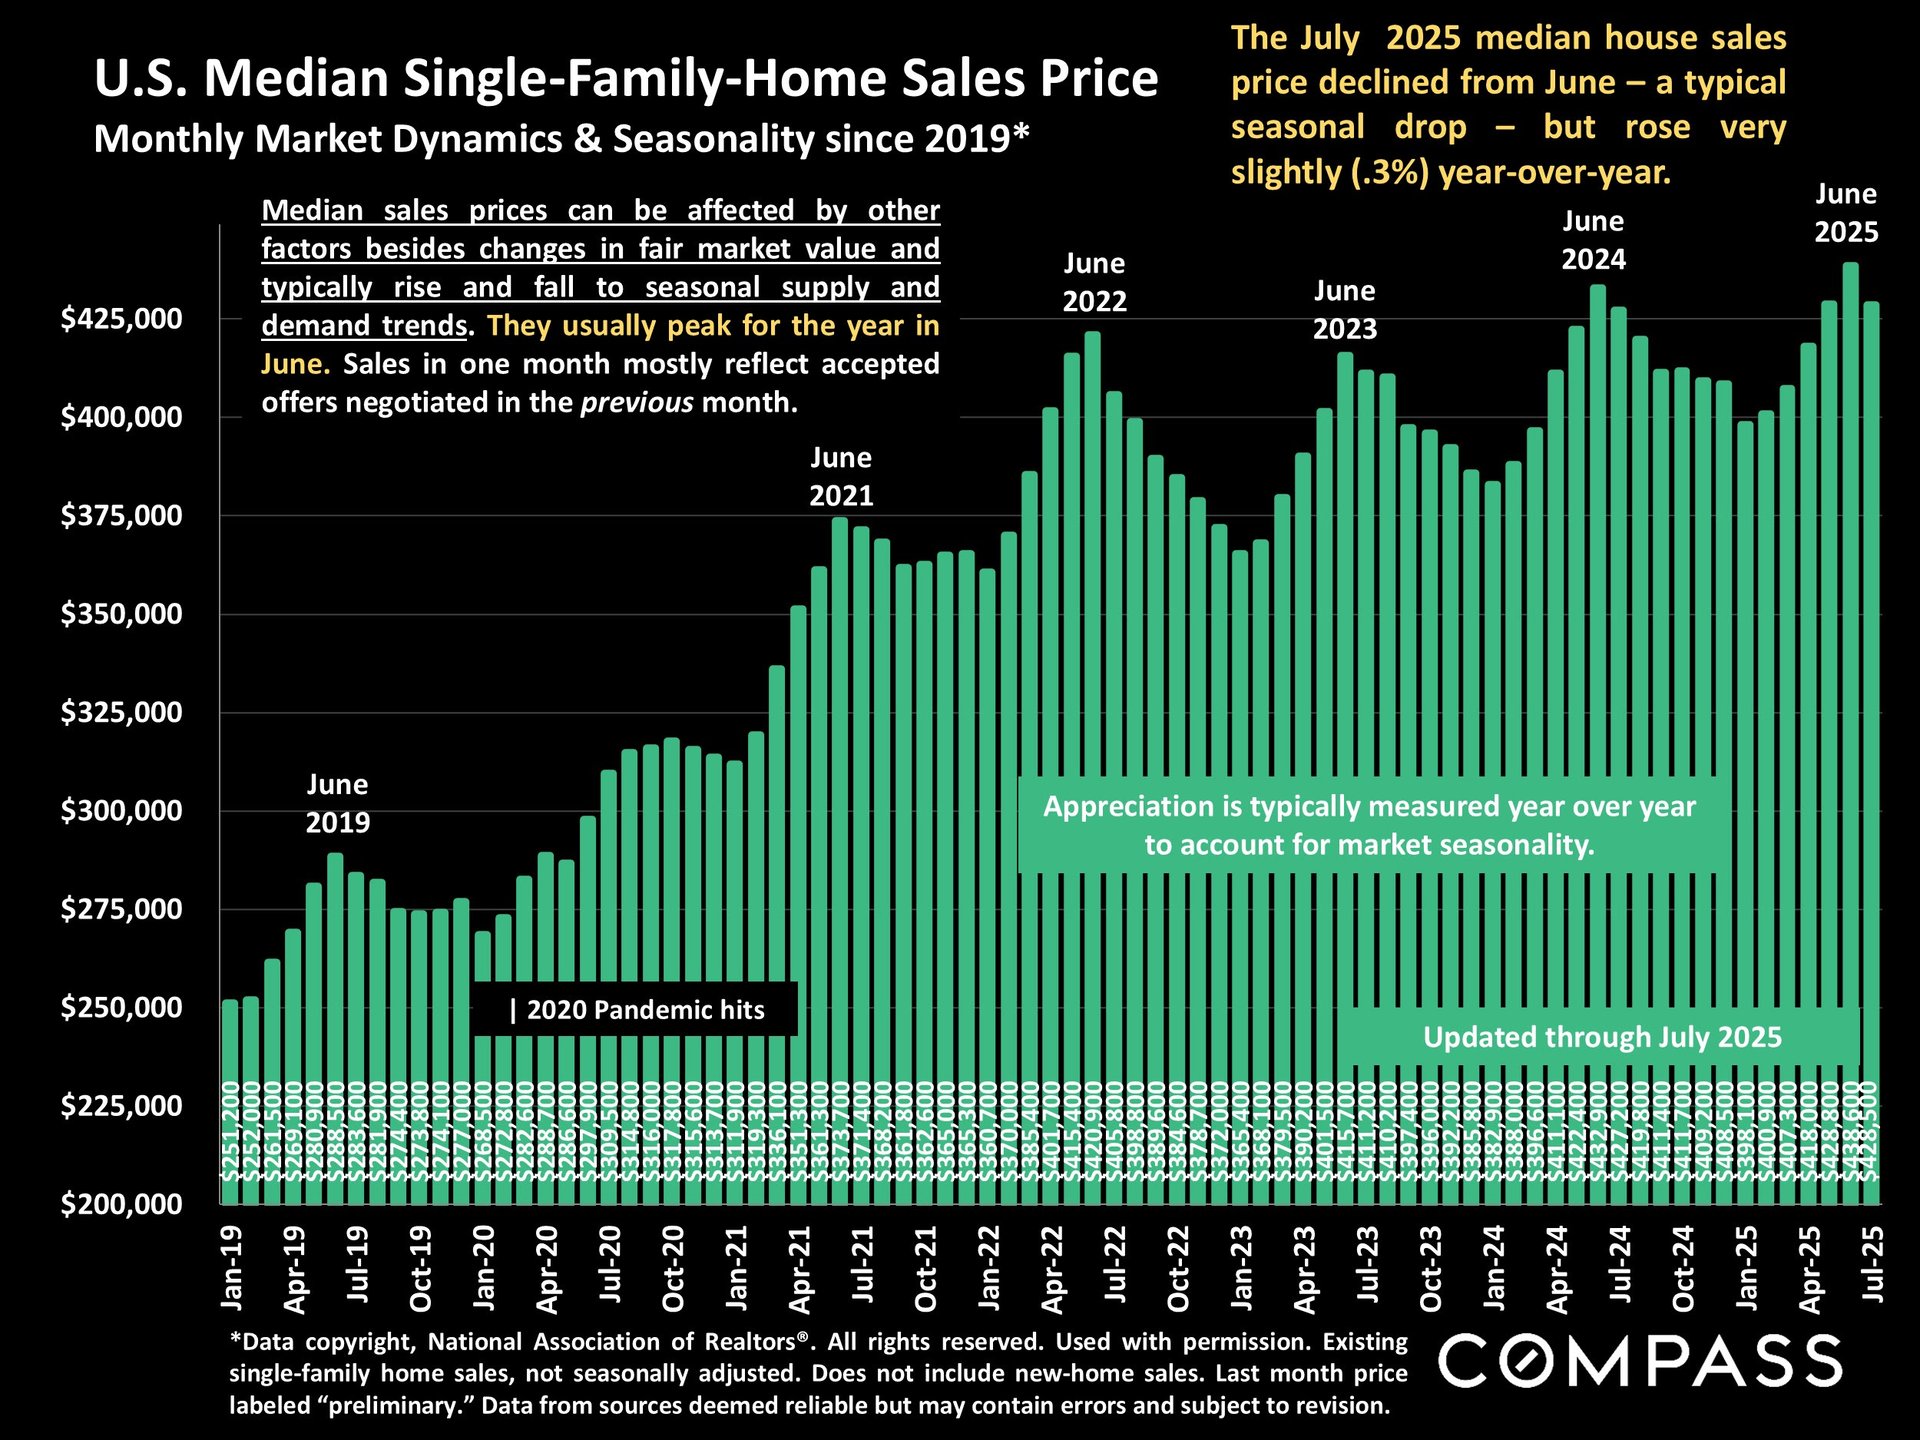
The year-over-year rate of median house price appreciation has been declining for months and the increase was negligible in July 2025,. (And for condos, not illustrated below, the y-o-y rate turned slightly negative in July.) Note that median home prices typically peak for the year in June because of seasonal dynamics.
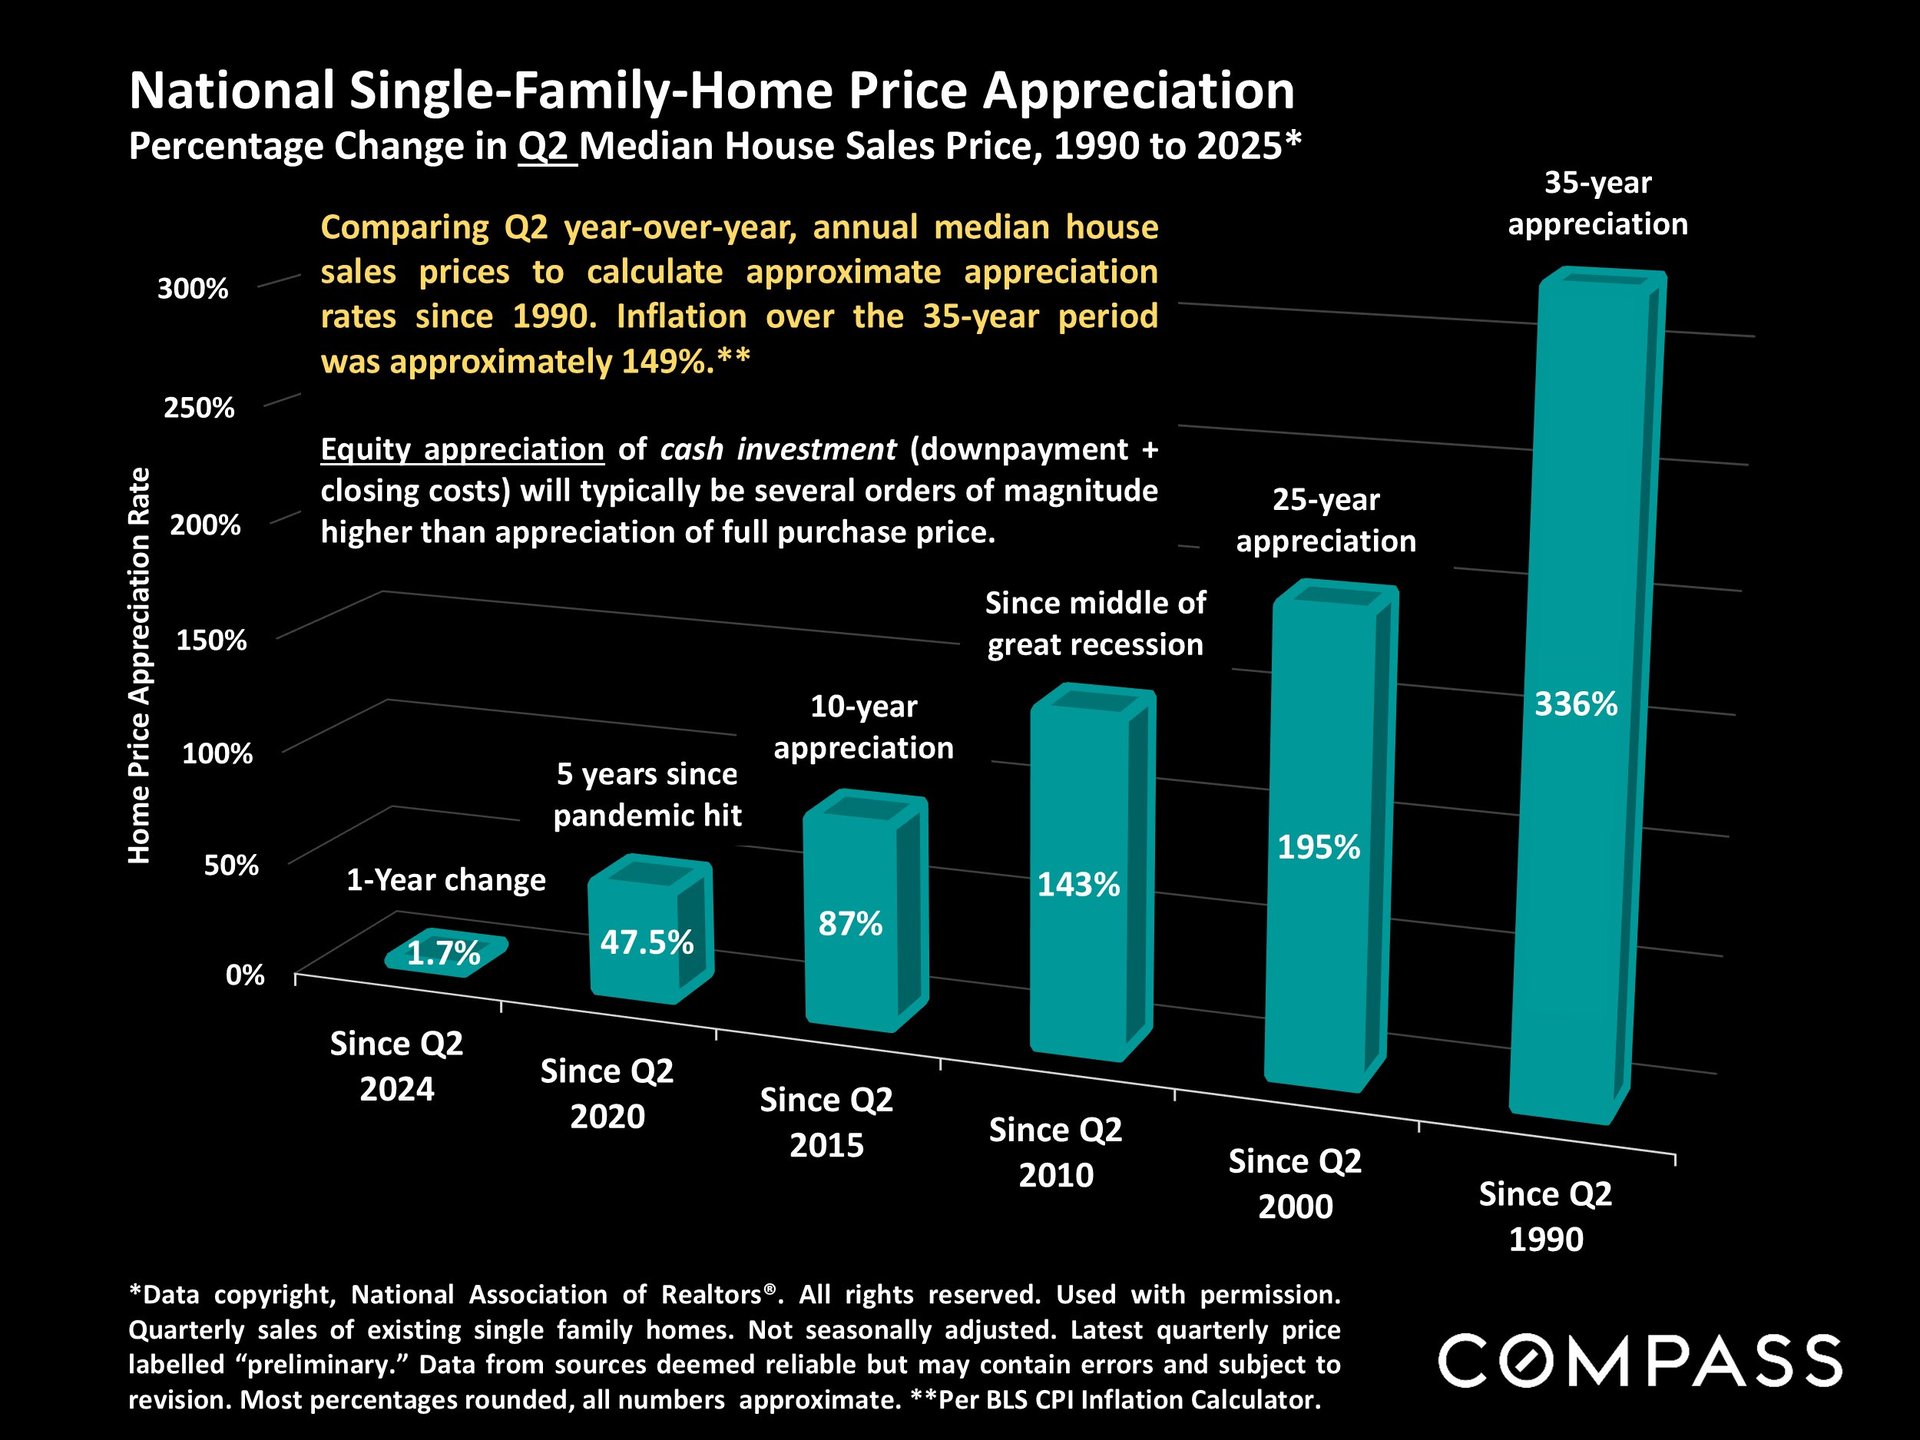
The chart below reviews national, year-over-year Q2 appreciation going back 1 to 35 years. After 4 years of furious price gains after the pandemic hit, the rate slowed dramatically in the past year. Note that this chart tracks appreciation of the full median purchase price, but buyers who financed their purchases saw much higher appreciation of their cash investments (i.e. down-payment and closing costs). And there are often substantial tax benefits. Over the longer term, homeownership has usually had enormous positive effects on household wealth.
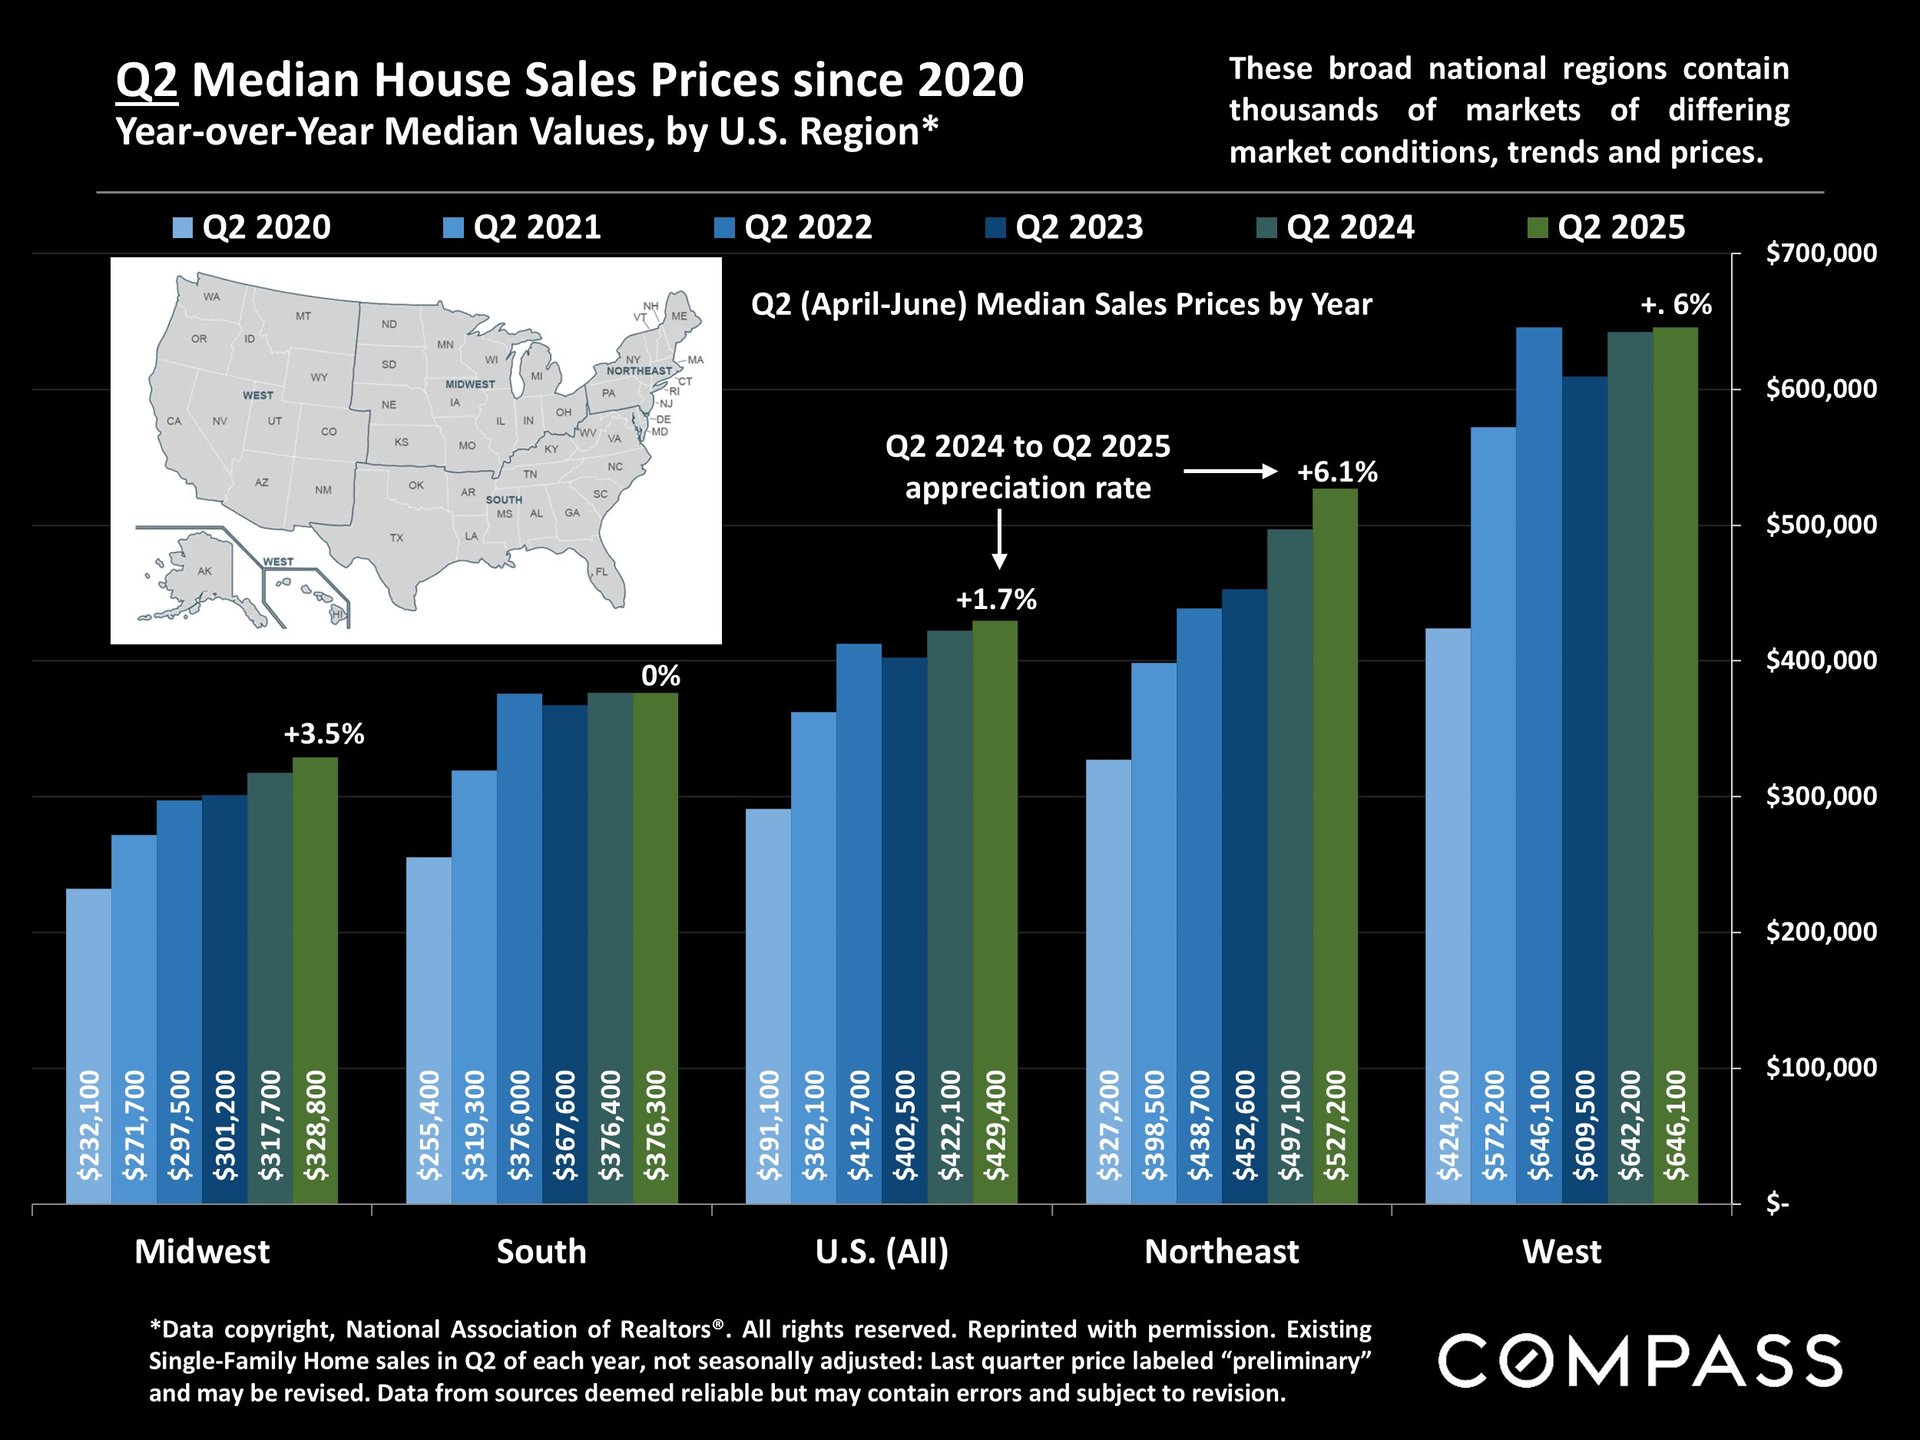
The next chart breaks down Q2 median home price changes since 2020, and Q2 2024 to Q2 2025 appreciation rates, for the 4 broad regions defined by the National Association of Realtors. The south region generally - with some of the hottest post-pandemic markets - had virtually no appreciation in the past year, while the northeast continued to appreciate rapidly.
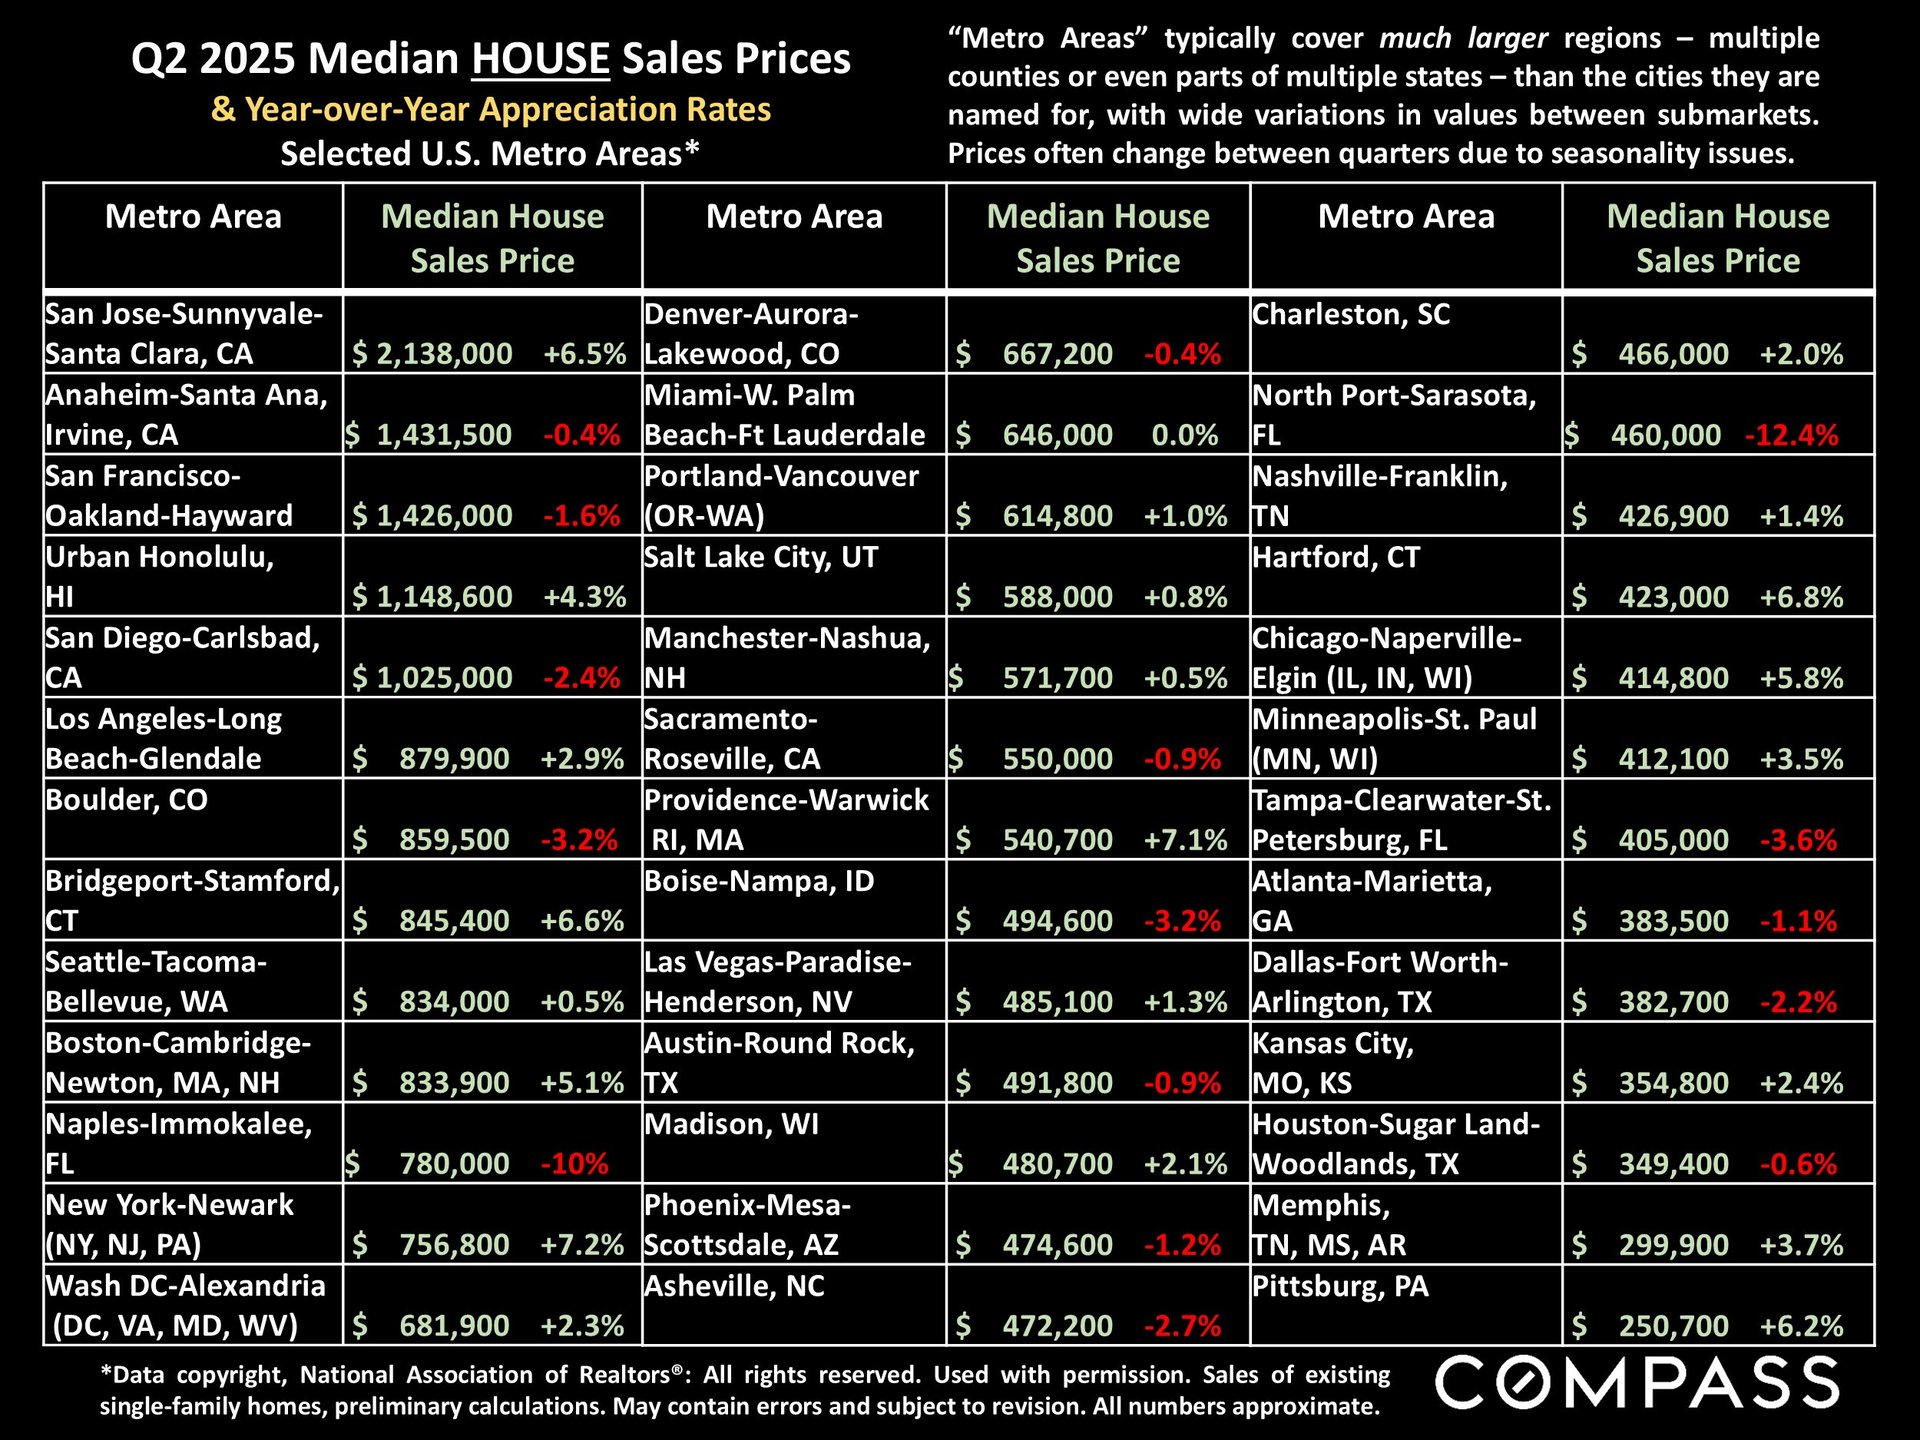
Below is a selection of major "metro-area" median house prices and year-over-year appreciation rates. Some of the markets that saw the highest demand 2020 to 2024 - including many in Florida and Texas - have seen price declines in the last year. Many factors are at play including overbuilding of new homes, soaring insurance rates, changes in immigration and tariff policies, and simply that markets that get the most overheated often see the larger reaction when conditions cool. On the other hand, as mentioned earlier, many northeast metros continued to see considerable increases in median home prices.
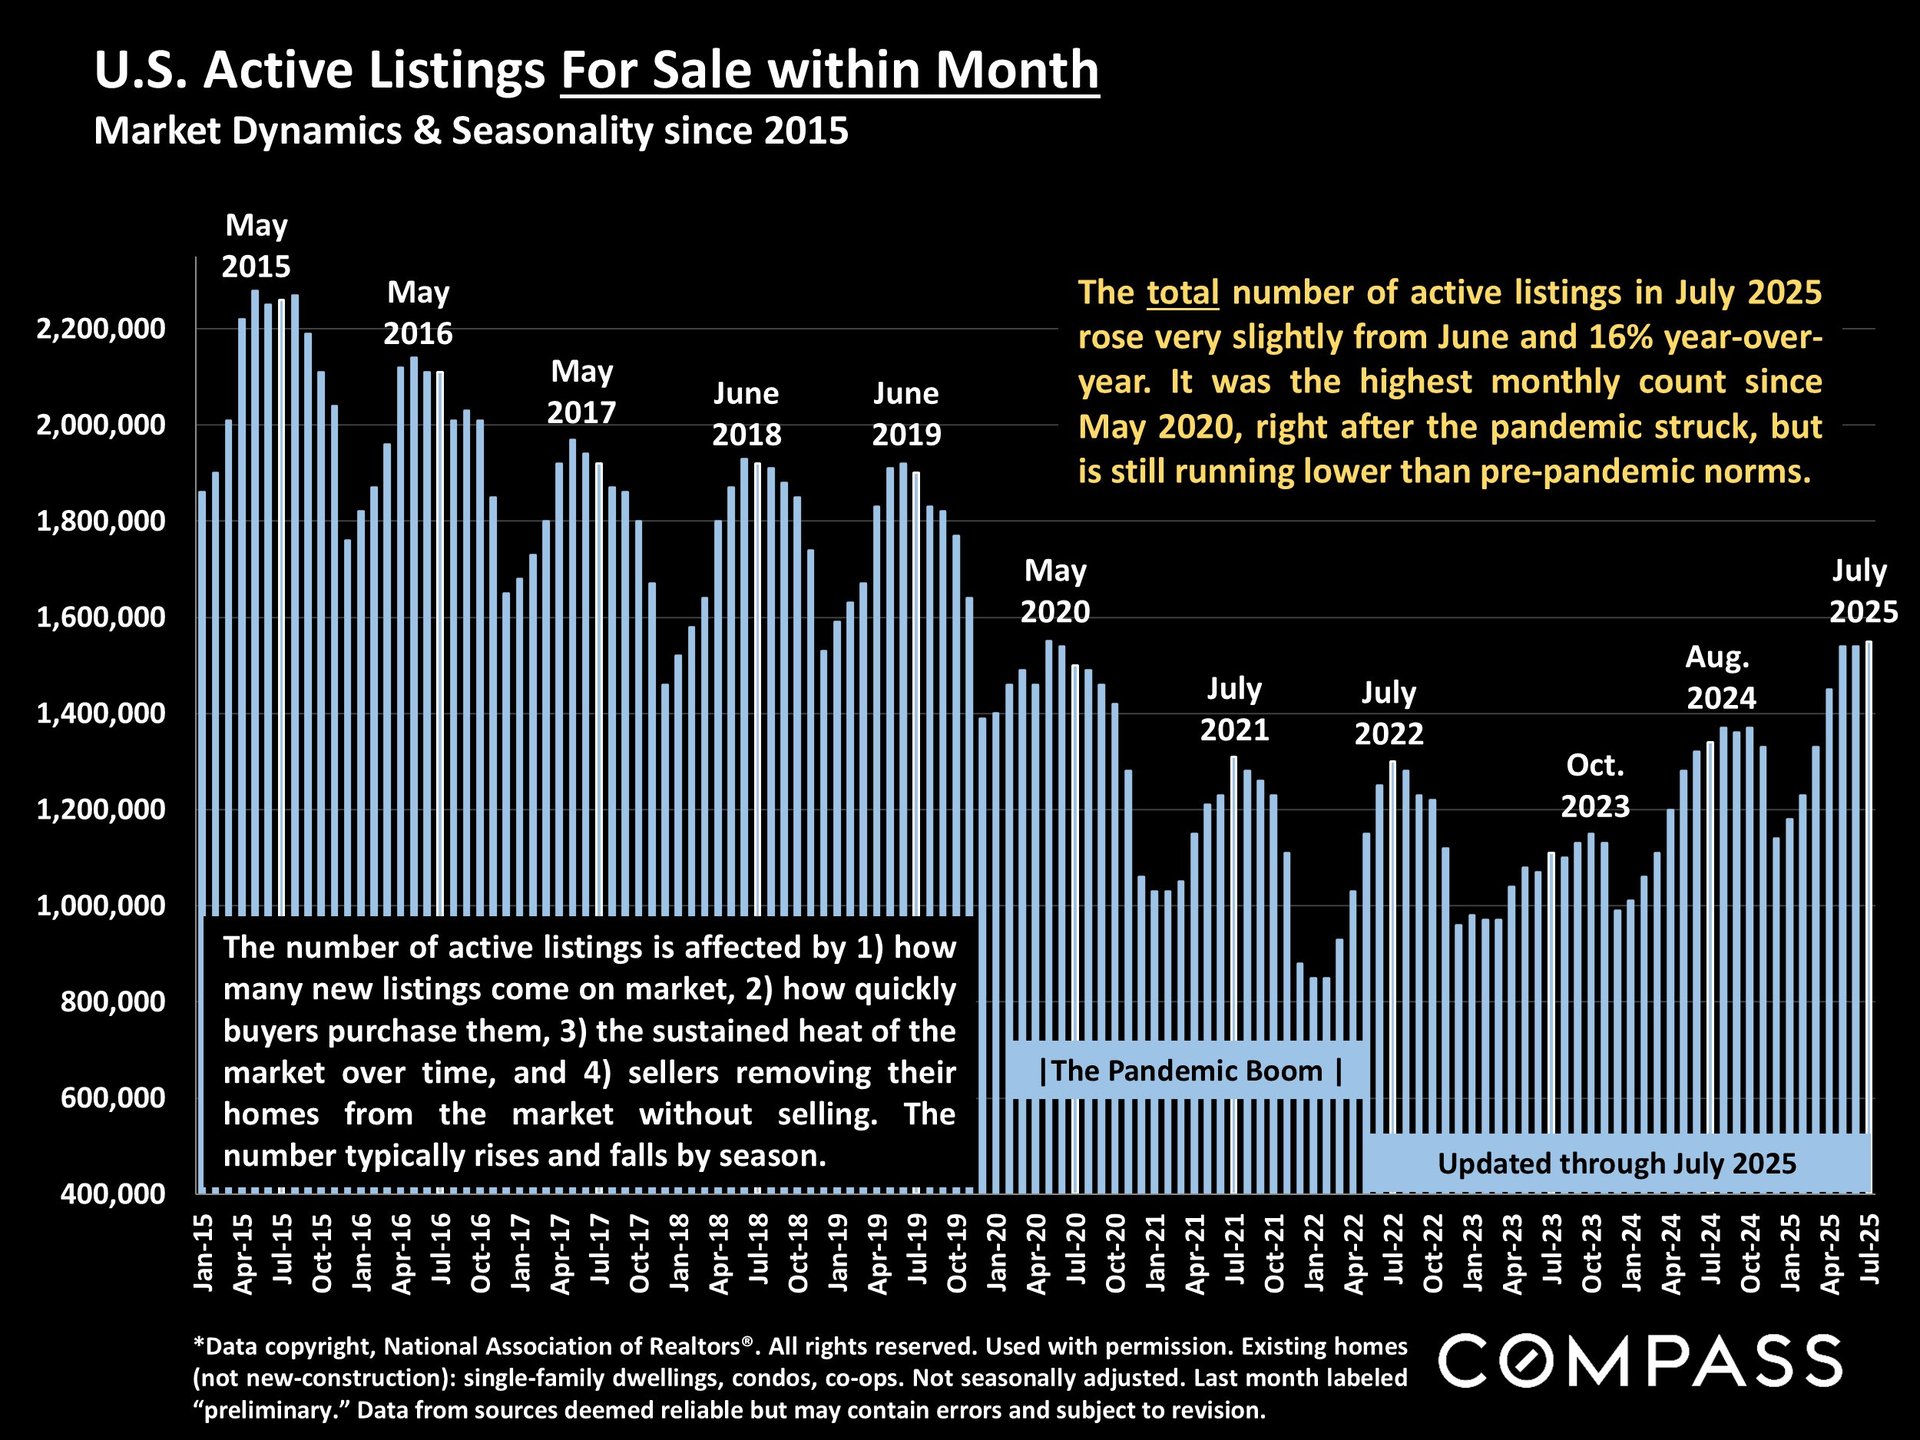
Of course, the biggest change in market dynamics has been the rapid increase in the number of homes for sale. With the softening of demand in the last 4 to 5 months, a major shift has occurred in the balance of power between buyers and sellers. Note however that many homes have continued to sell quickly at over asking price. In real estate, the devil is always in the details of each individual property: location, circumstances, condition, preparation, pricing and marketing.
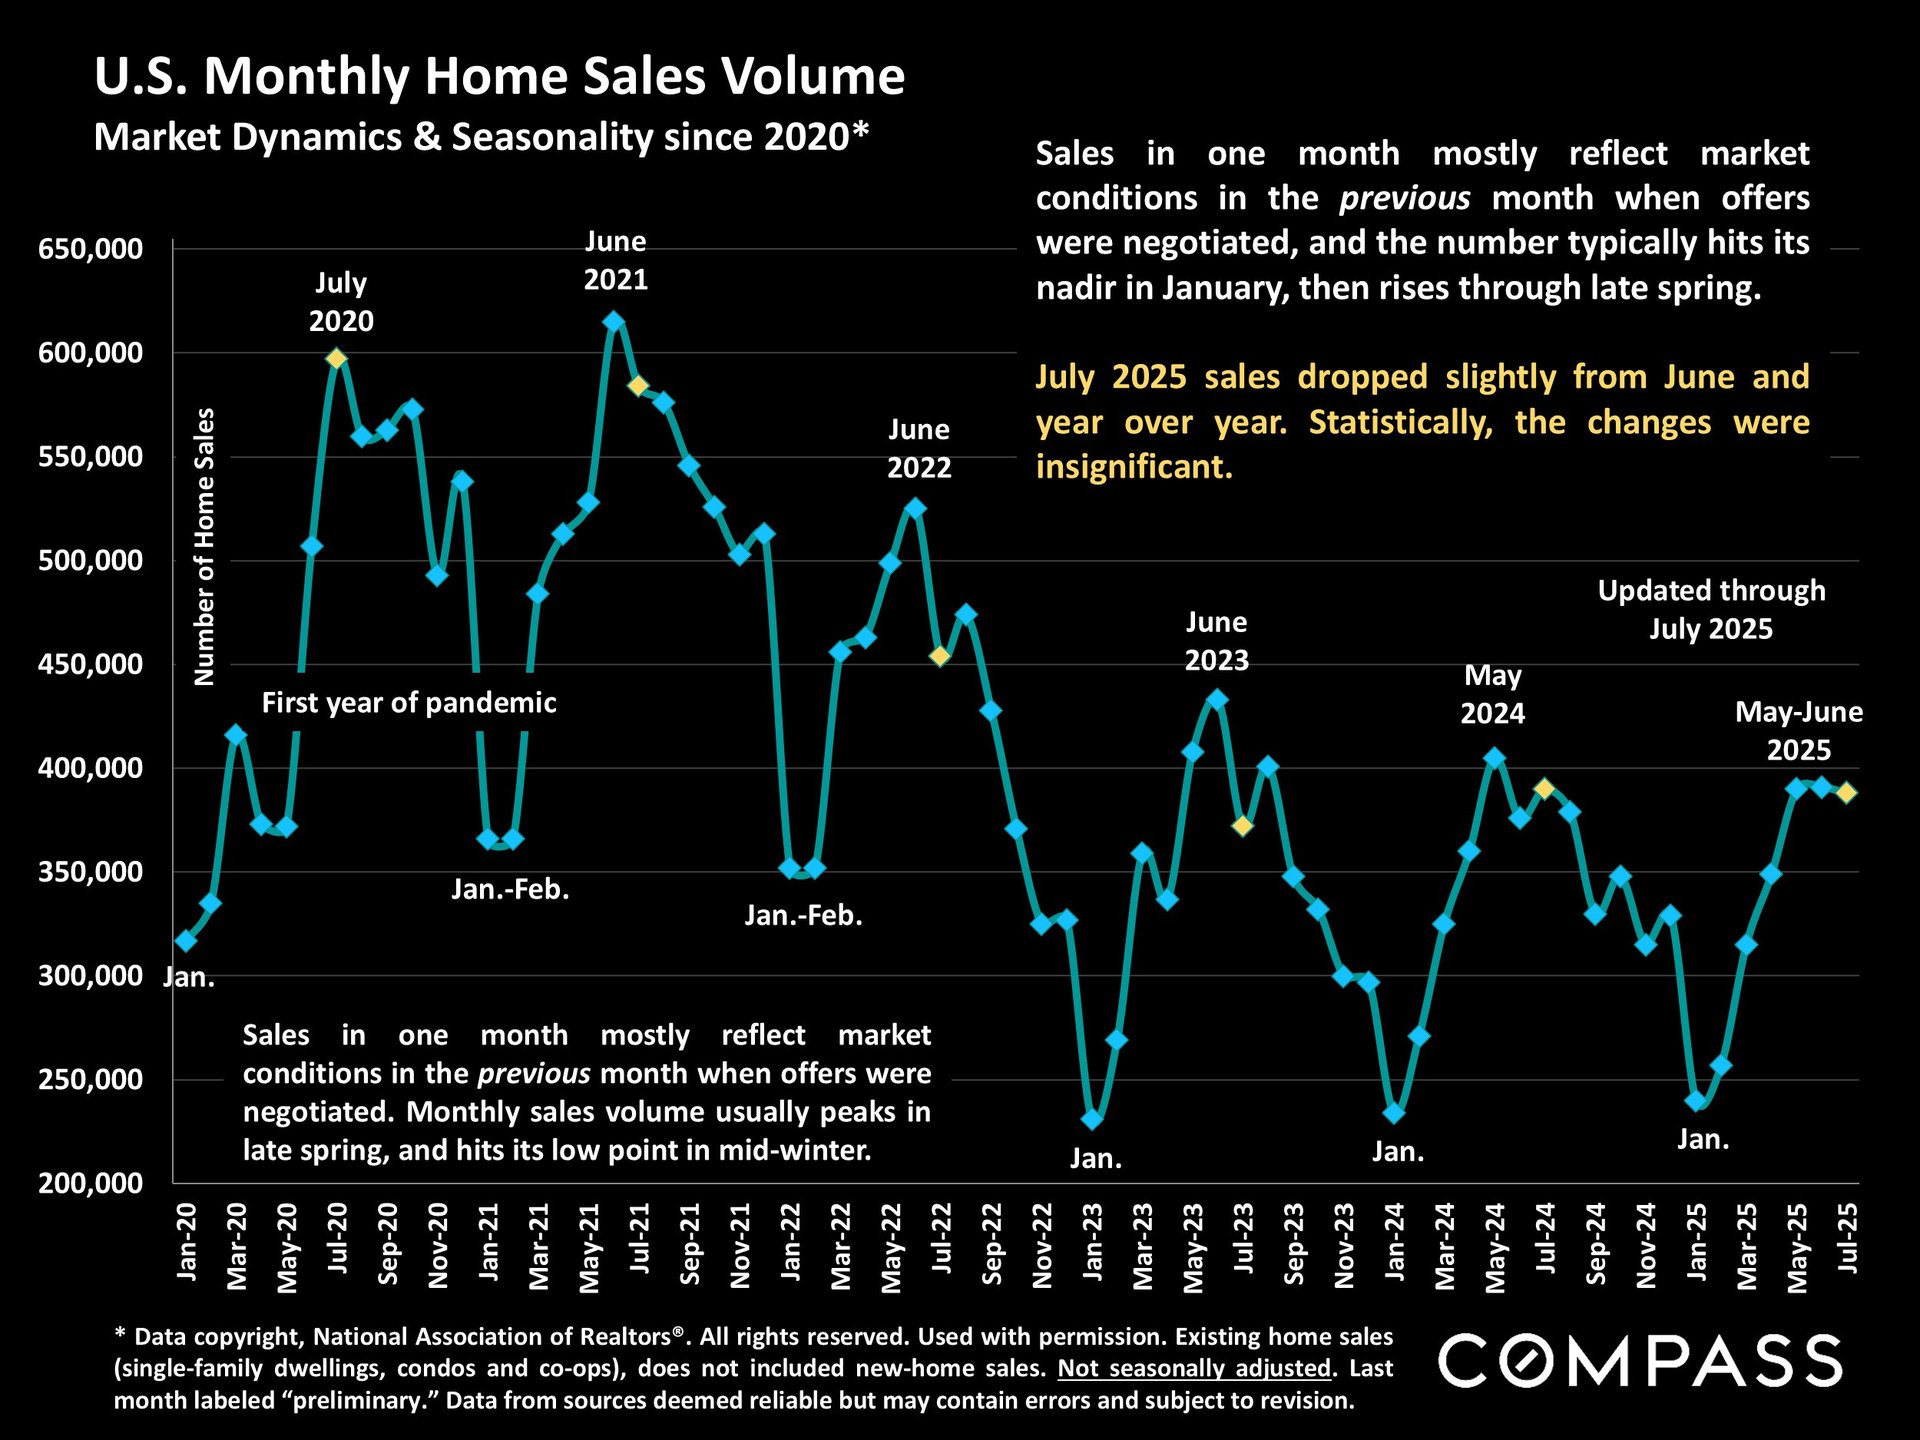
While supply has soared, sales activity since spring began has declined year over year - from the relatively depressed levels prevailing since interest rates jumped in 2022. Buyers now have a greater choice of listings - which reduces their sense of urgency to act quickly - and sellers are increasingly likely to have to compete for the attention of those buyers.
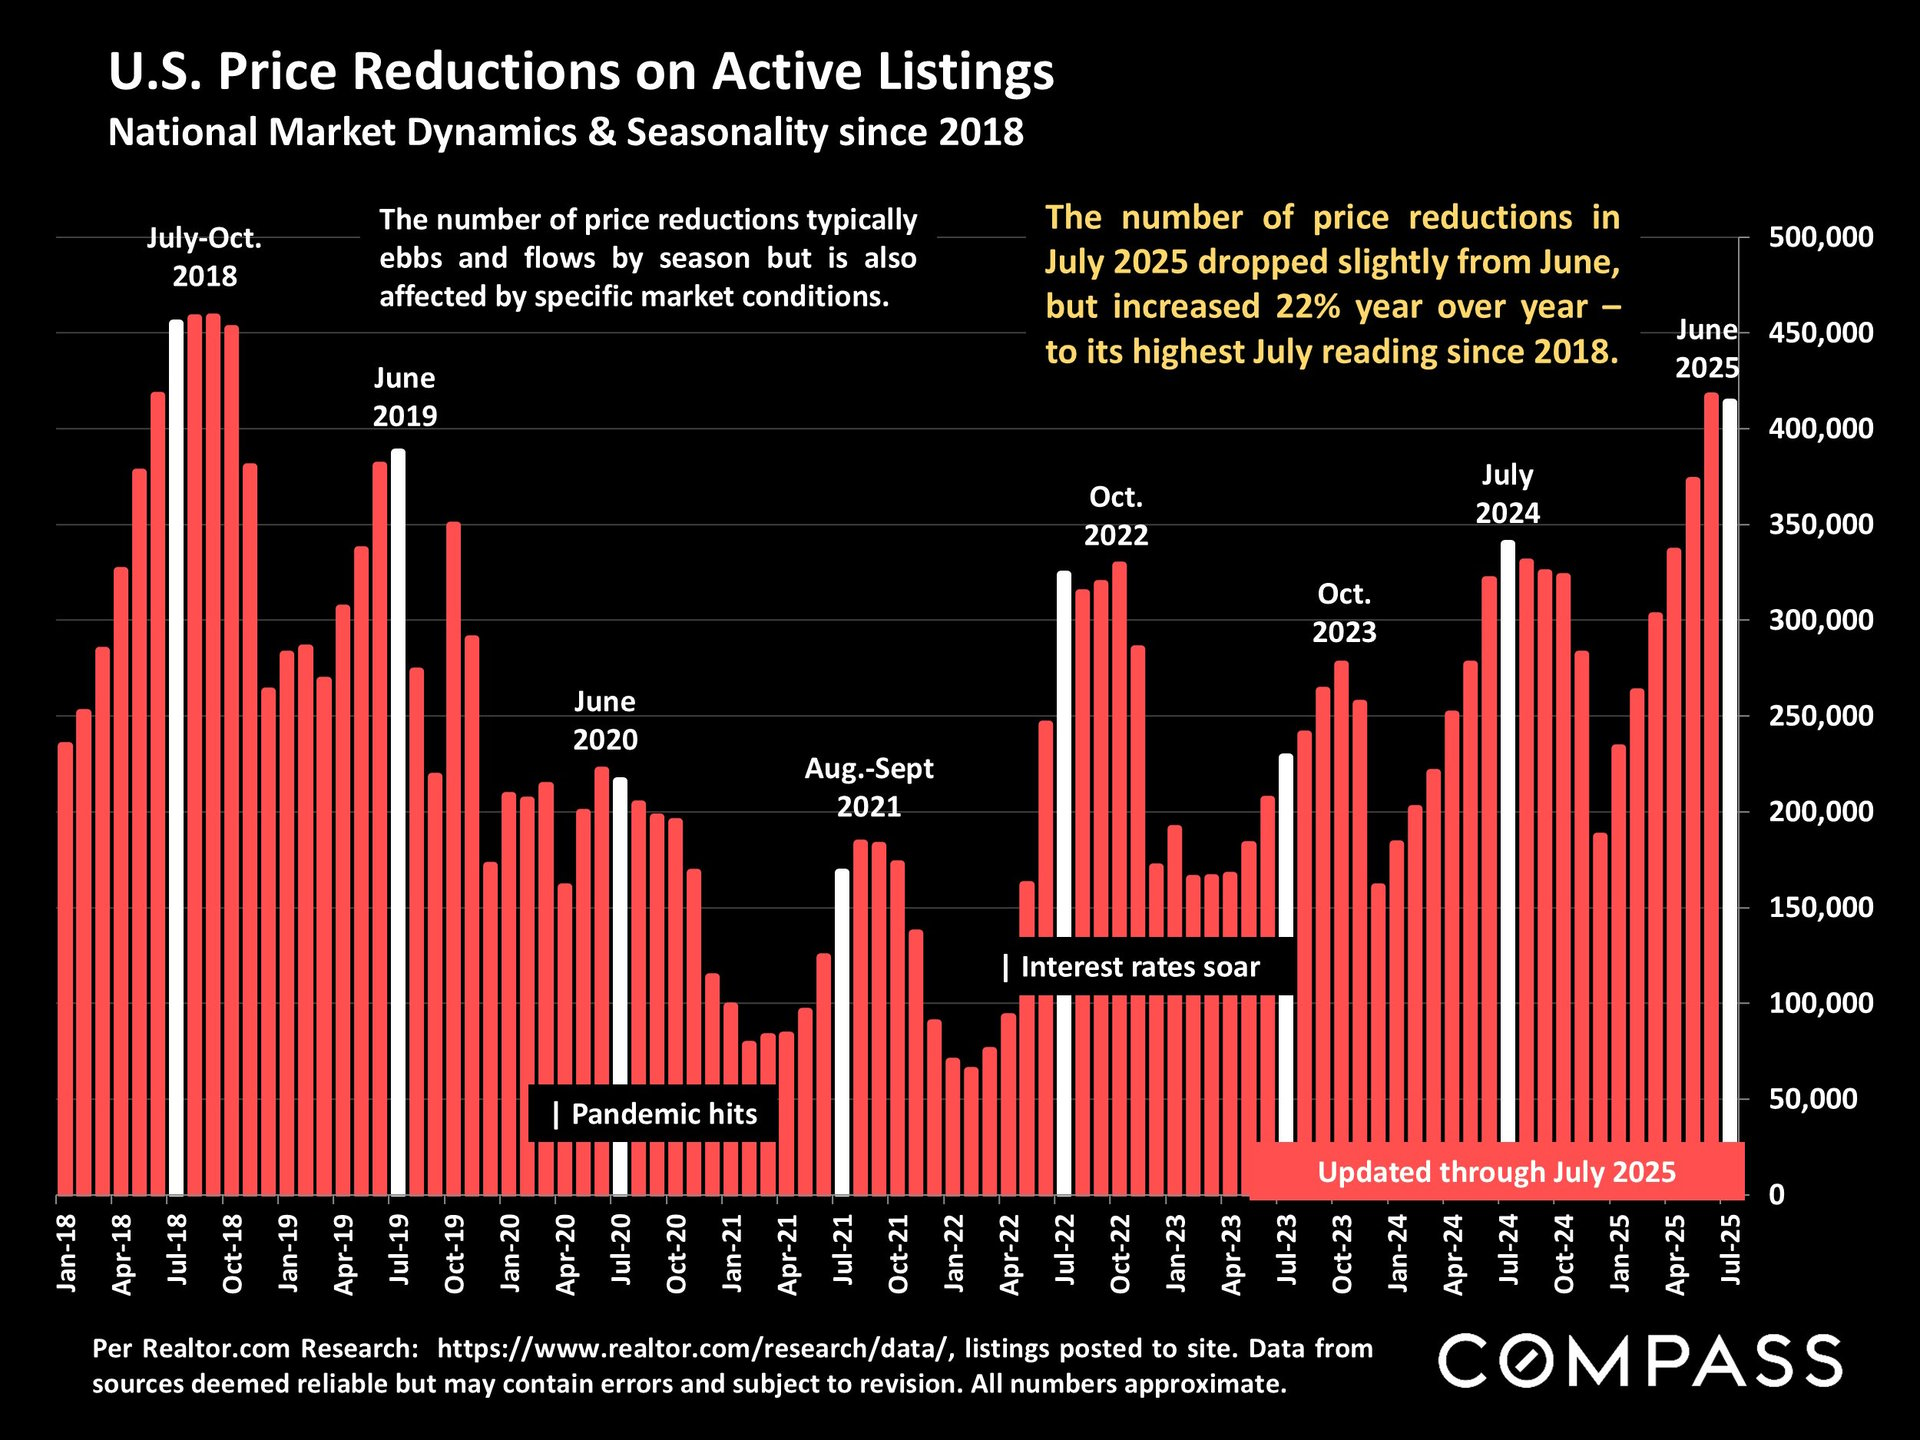
And so price reductions in the last 2 months are at their highest level since 2018. For sellers who wish to get the highest possible sales price, it is imperative to prepare and price correctly right from the start. Buyers who want the best deals should keep a very close eye on price reductions and days on market: Just because a listing hasn't sold yet doesn't mean it can't be a great home at an excellent price.
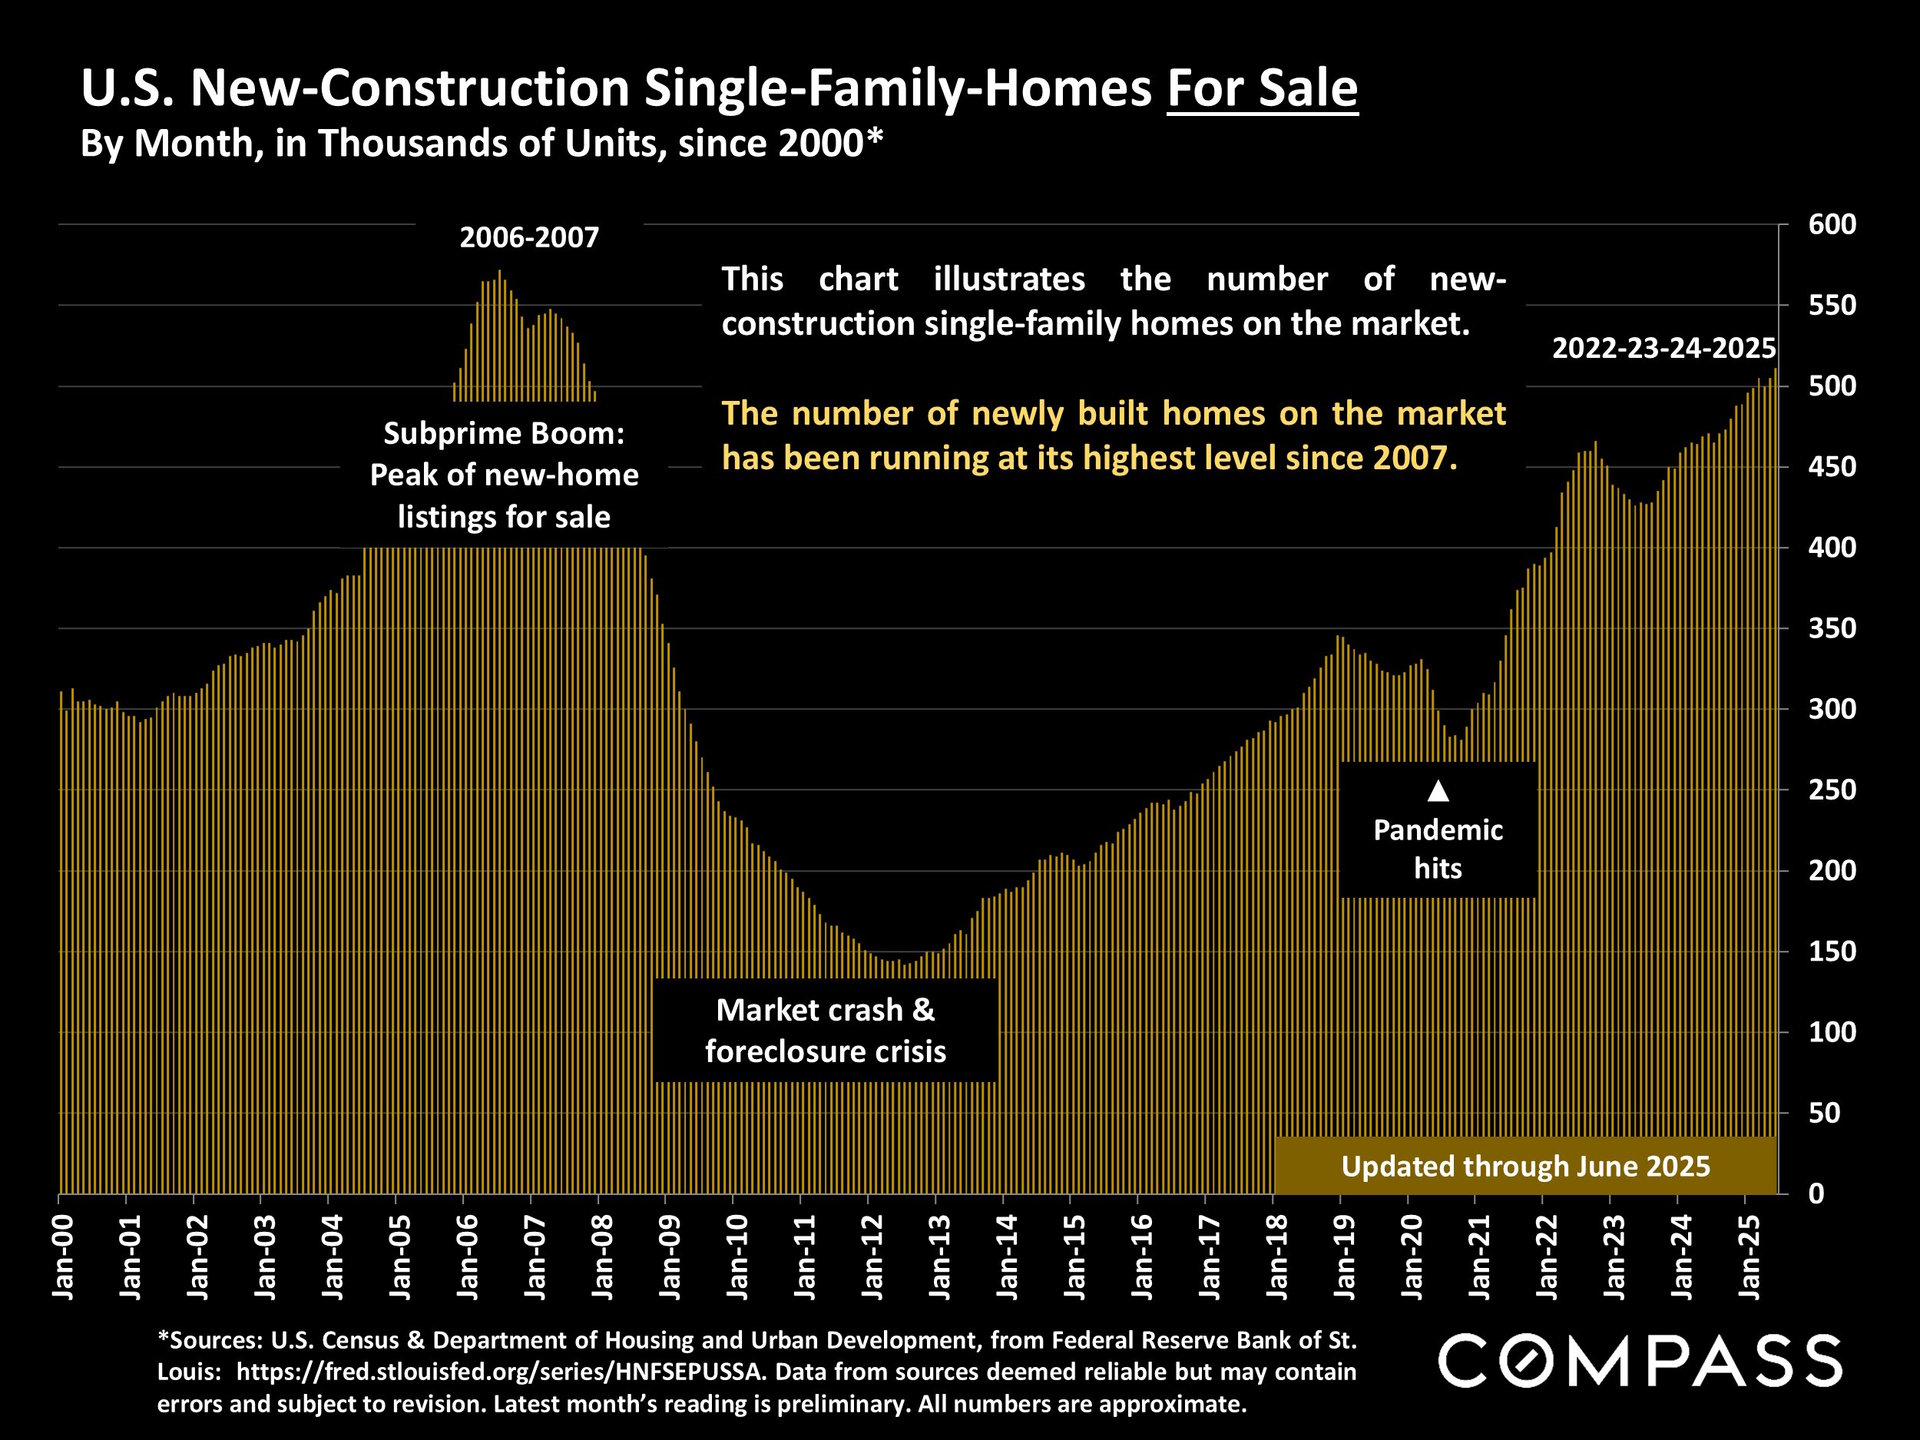
Supply in the new-homes segment is at its highest level since 2007 and developers are offering buyers significant financial concessions and incentives to move their inventory. This is then affecting resale markets where new construction has been concentrated in recent years: Mostly more affordable, southern states where it is easier and less expensive to build, with major population growth since 2020.
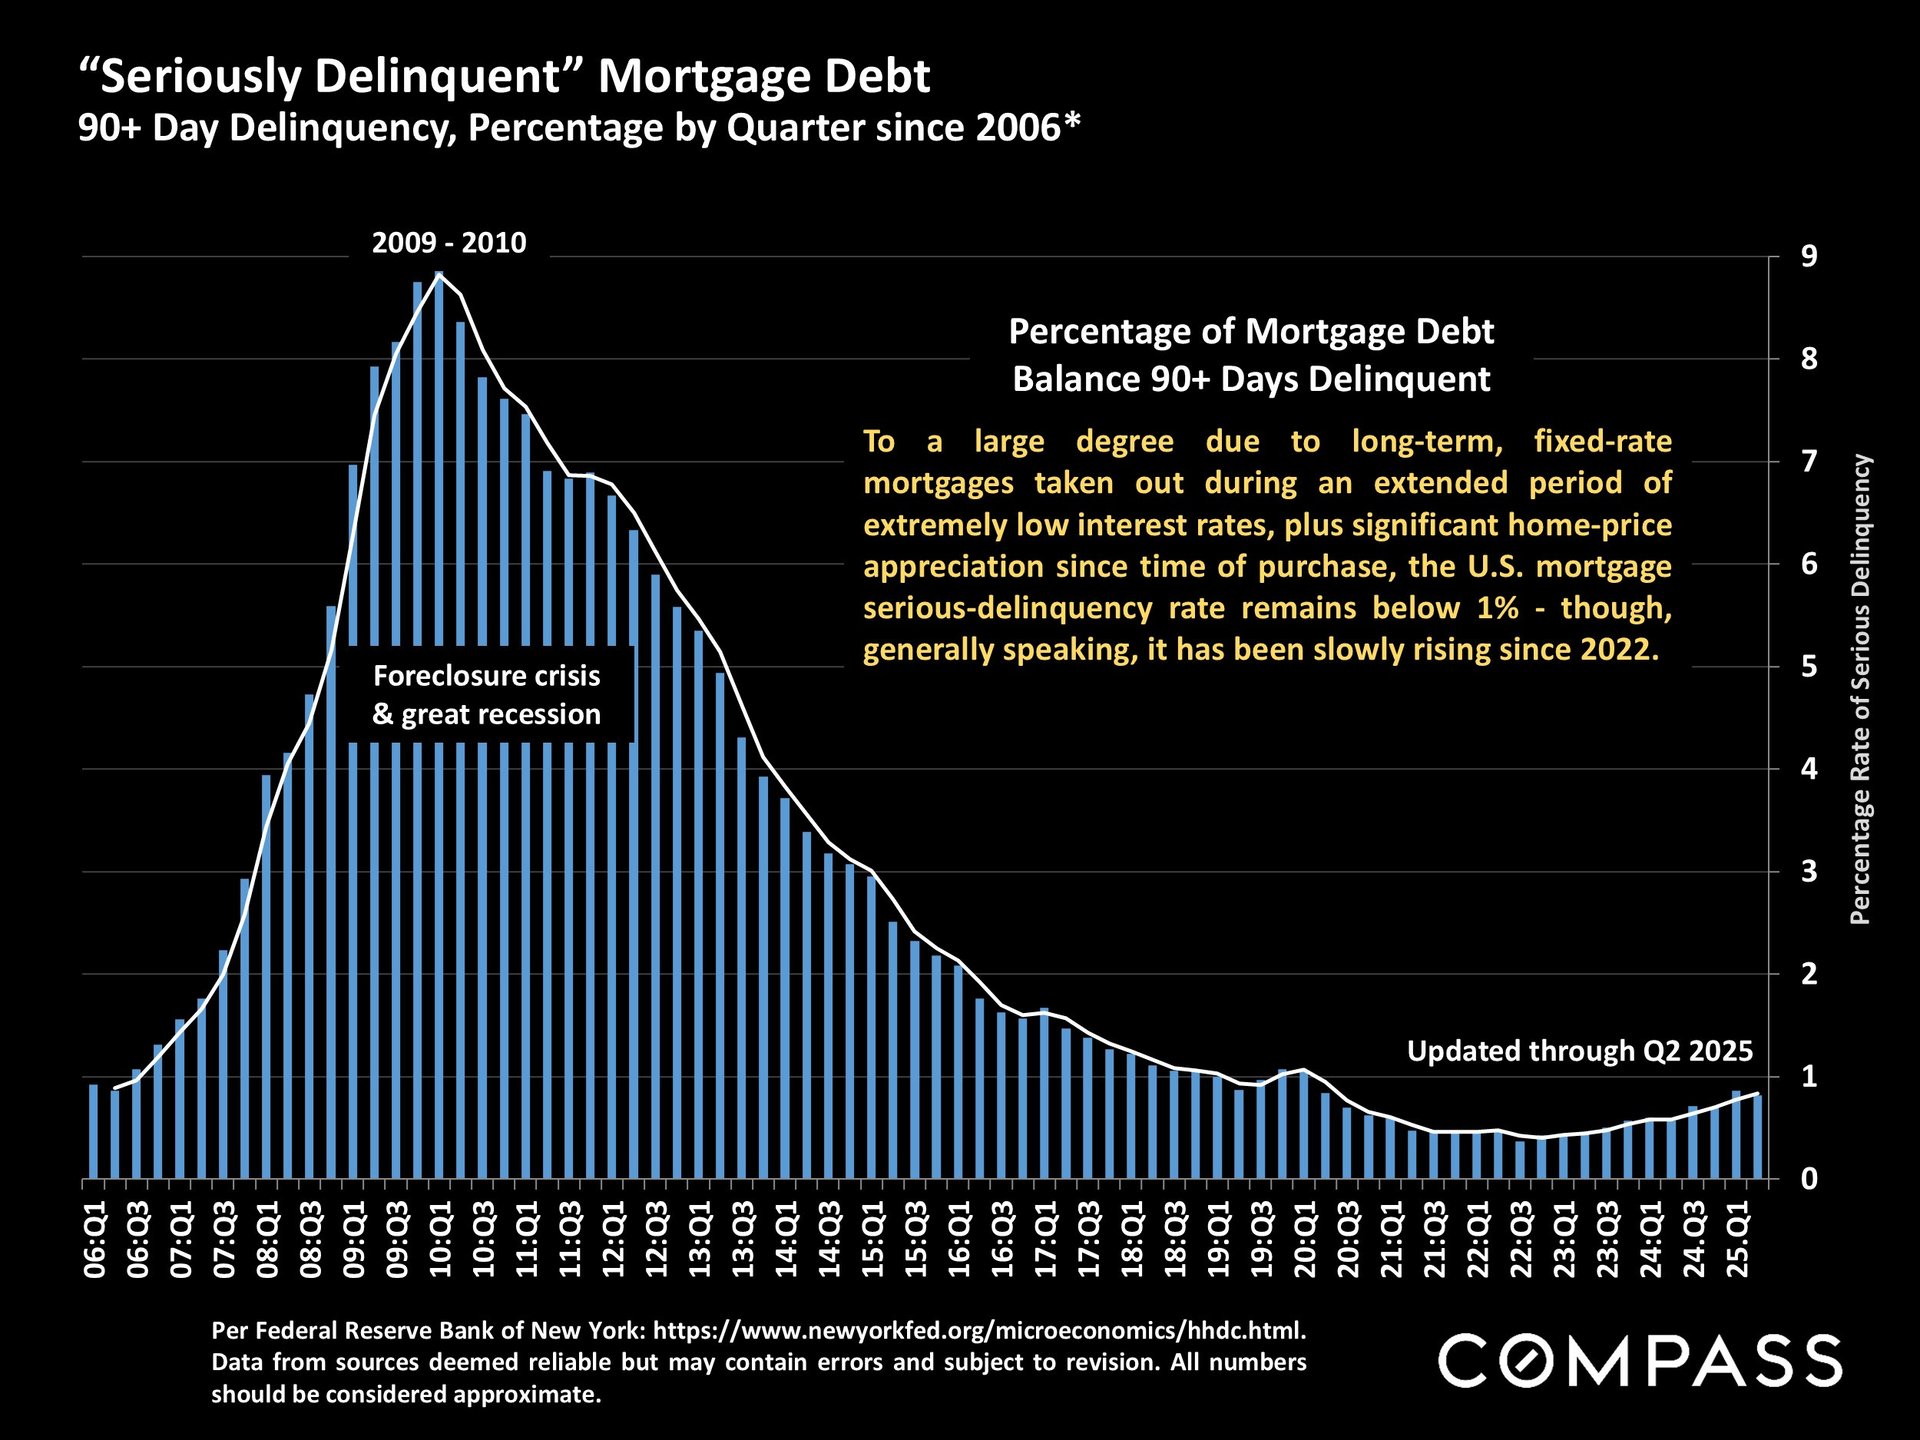
The increase in interest rates since 2022, and recent changes in policies regarding student loans, has led to more people carrying much higher levels of credit card, auto and student debt and falling behind on payments - which affects their ability to buy homes. However, due to the low interest rates many homeowners still enjoy on their mortgages, the growing percentage of homes owned free and clear, and home appreciation rates, the level of delinquent mortgage payments, as well as distressed property sales, remains close to historic lows.
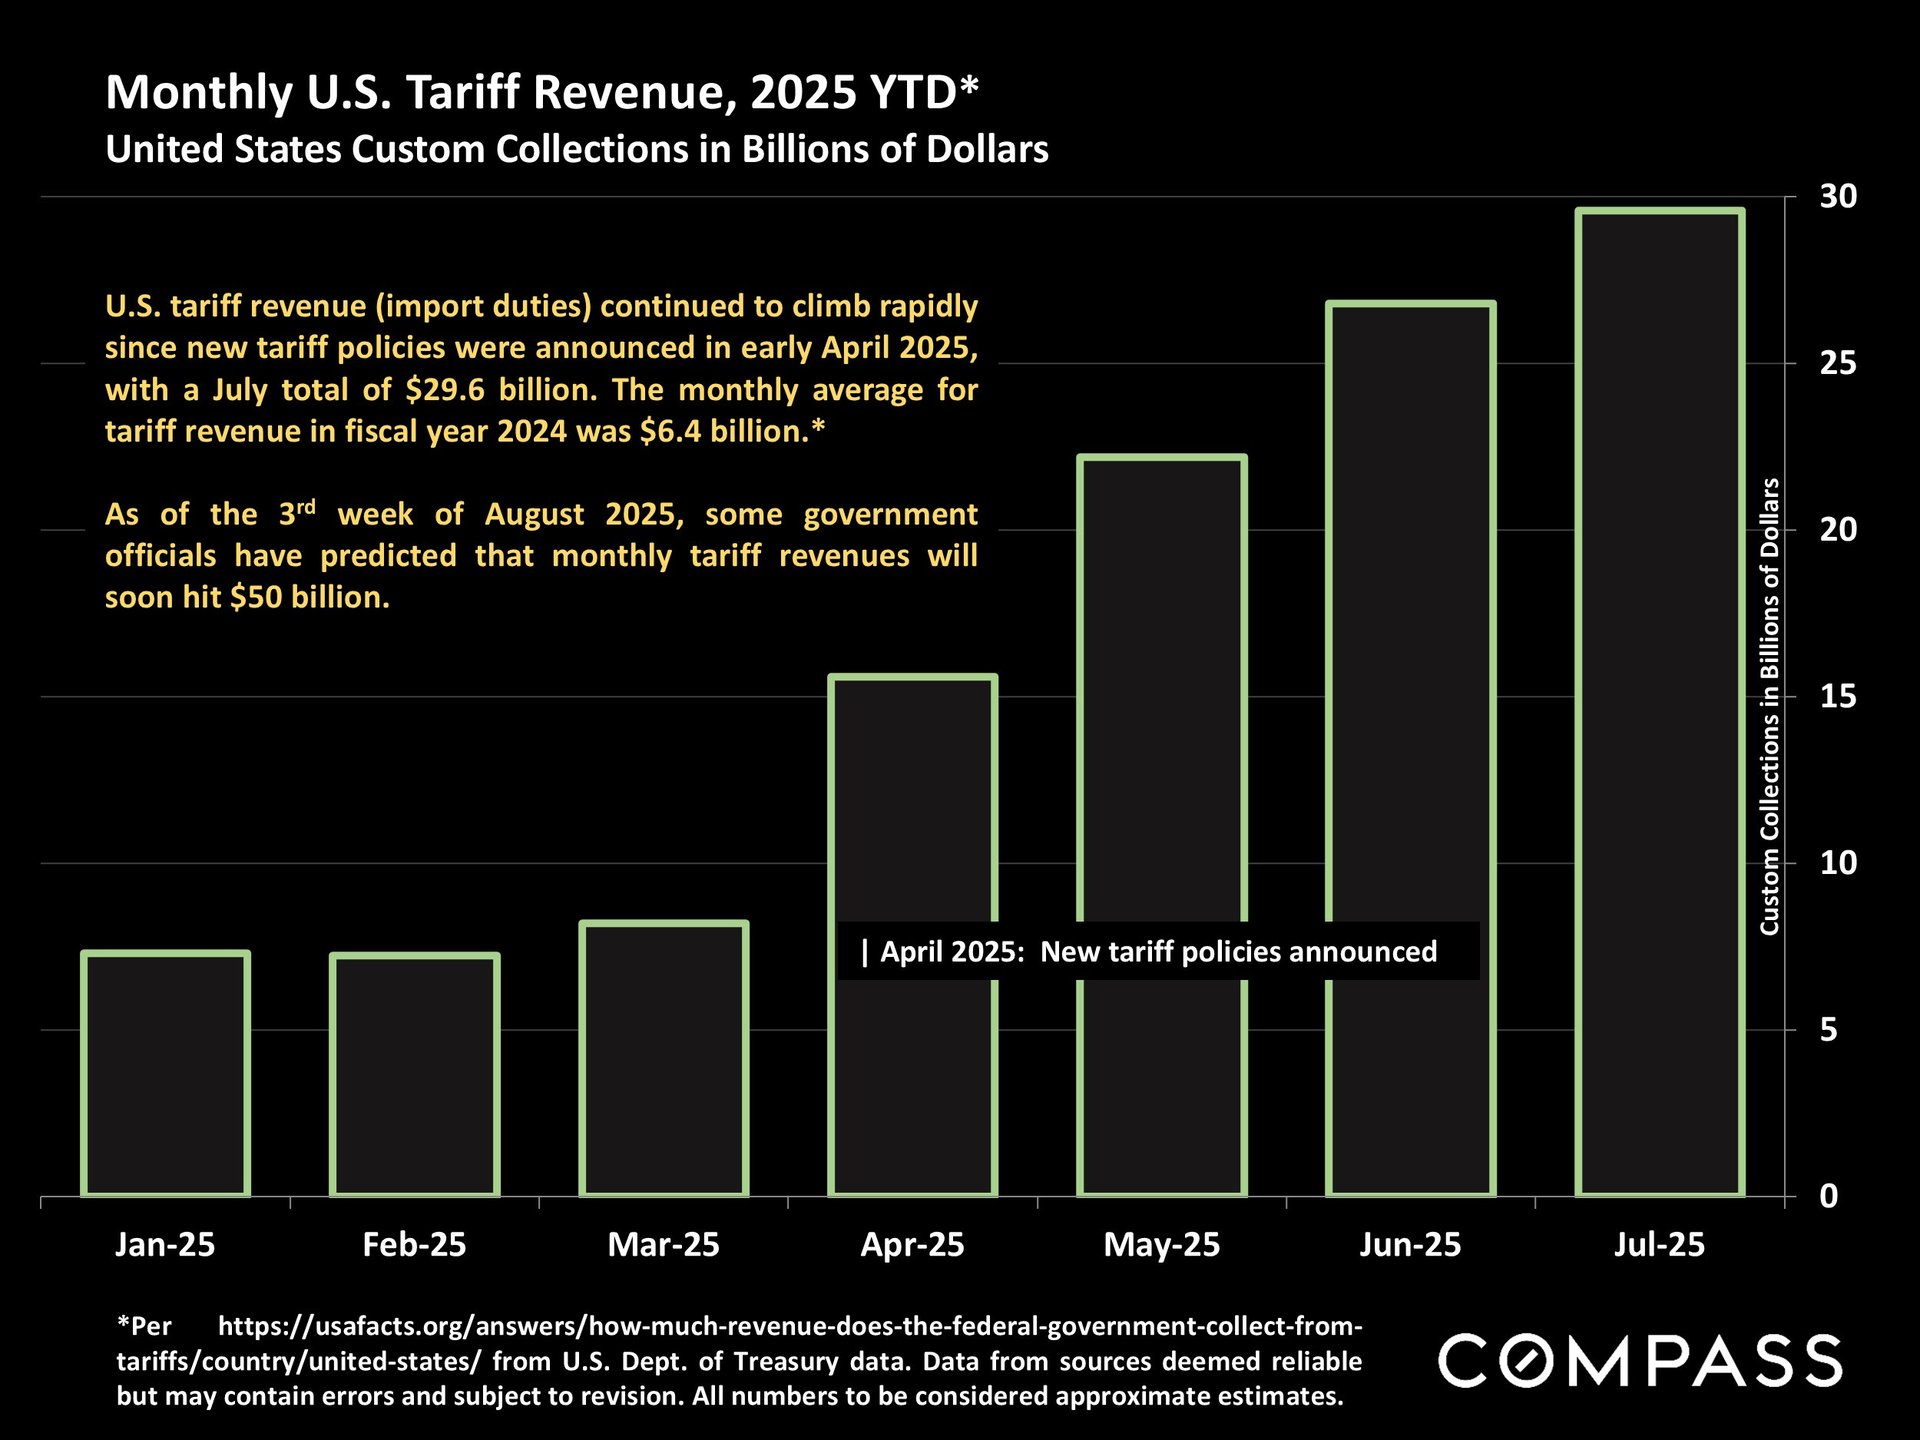
Since tariffs are much in the news, the next chart illustrates the change in revenue accruing to the federal government due to policy changes since April - possibly to an annual rate of over $600 billion per year since custom collections are expected to increase further. As far as the housing market is concerned, the big issue is whether - and, if so, how much - tariffs may affect inflation and interest rates.
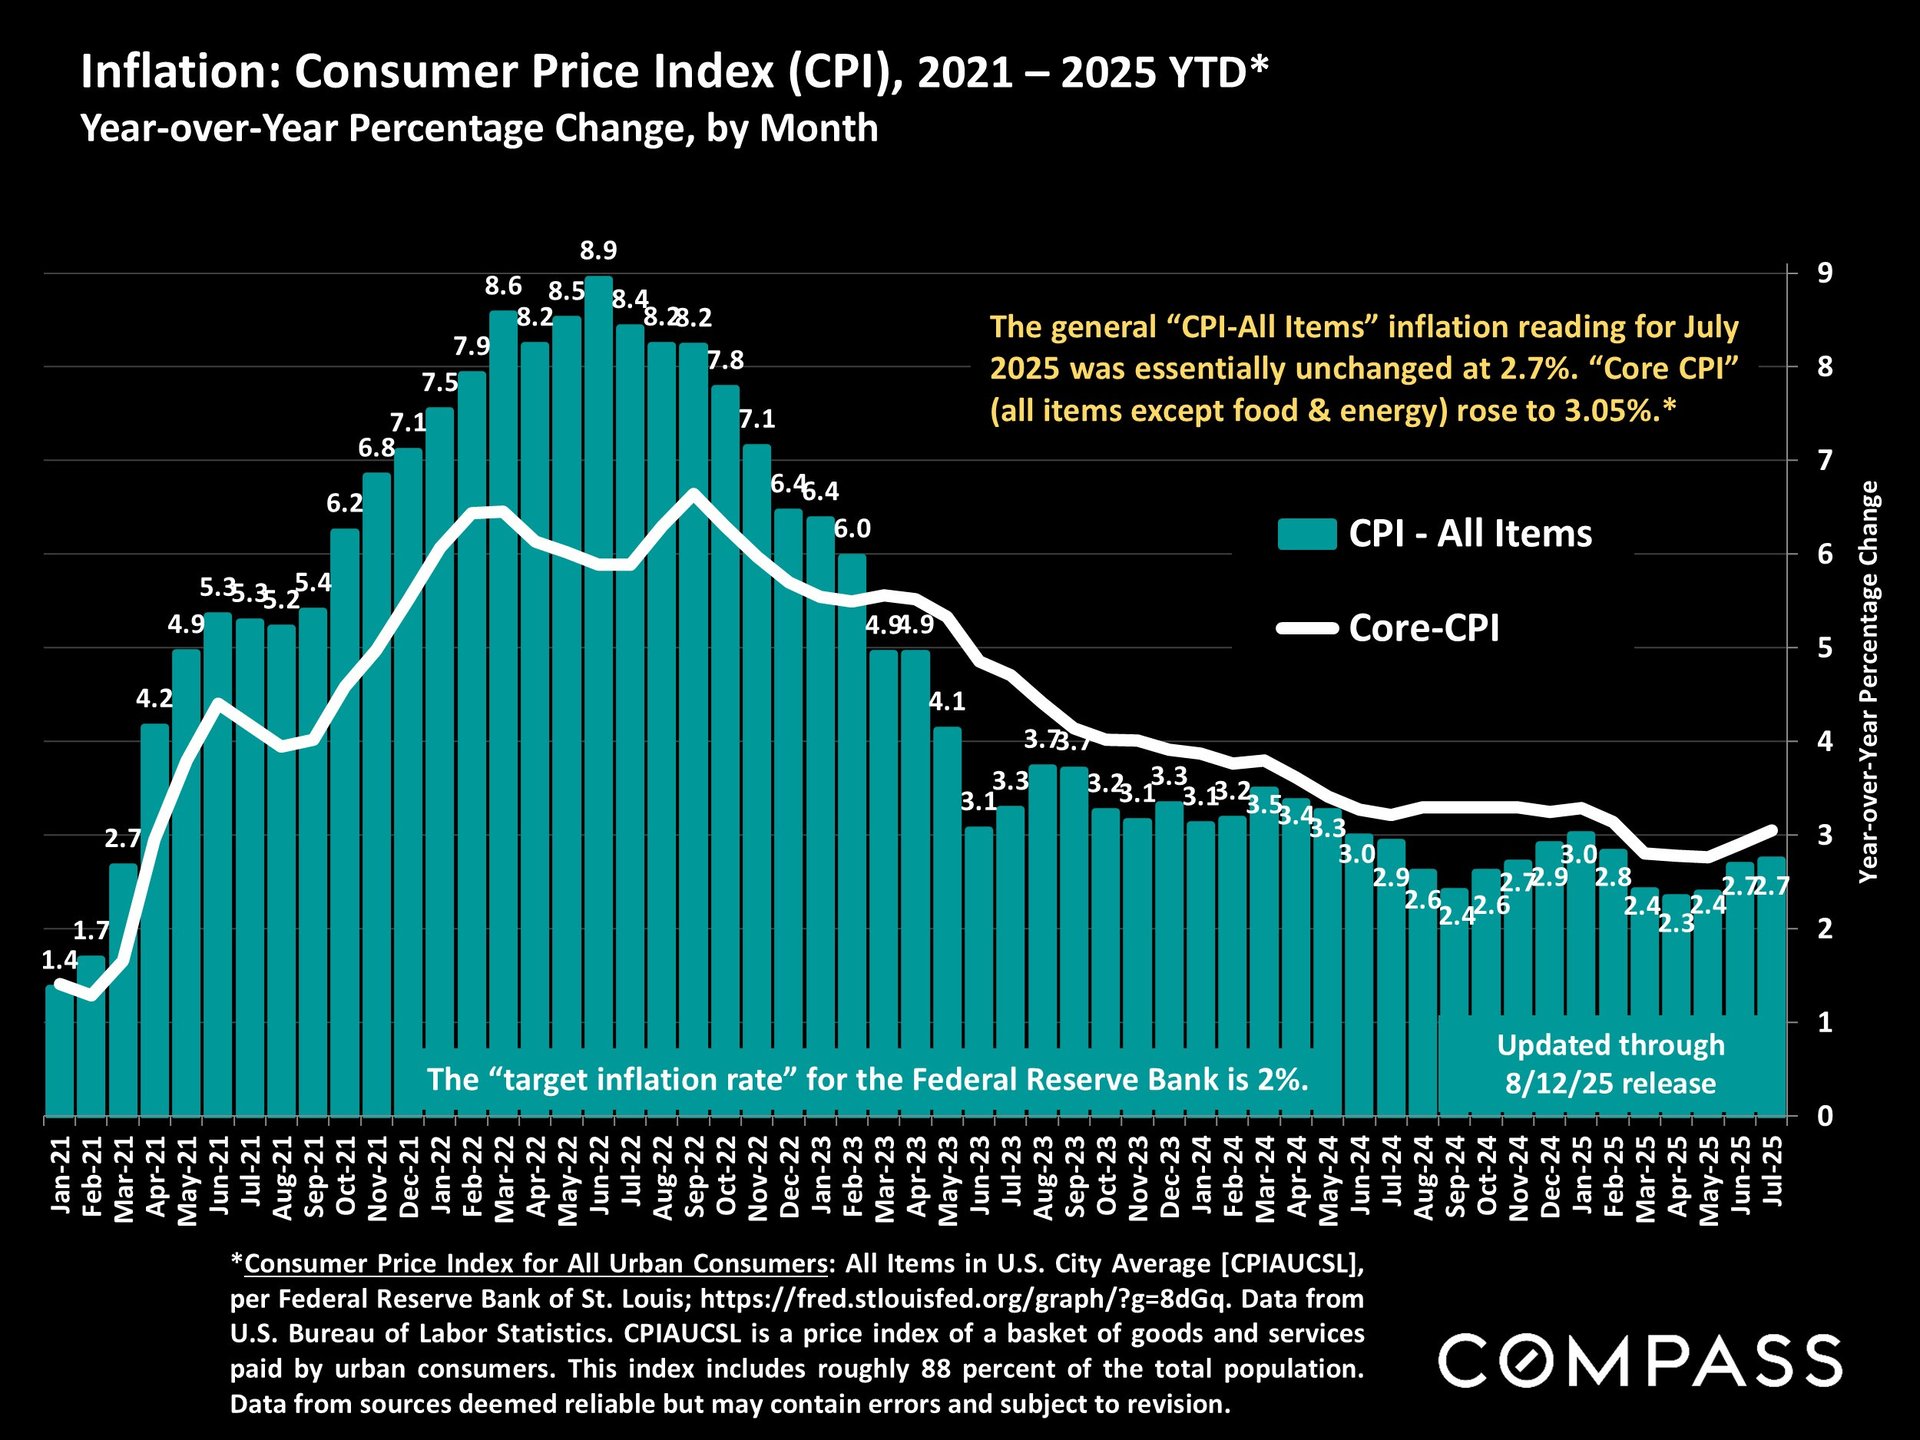
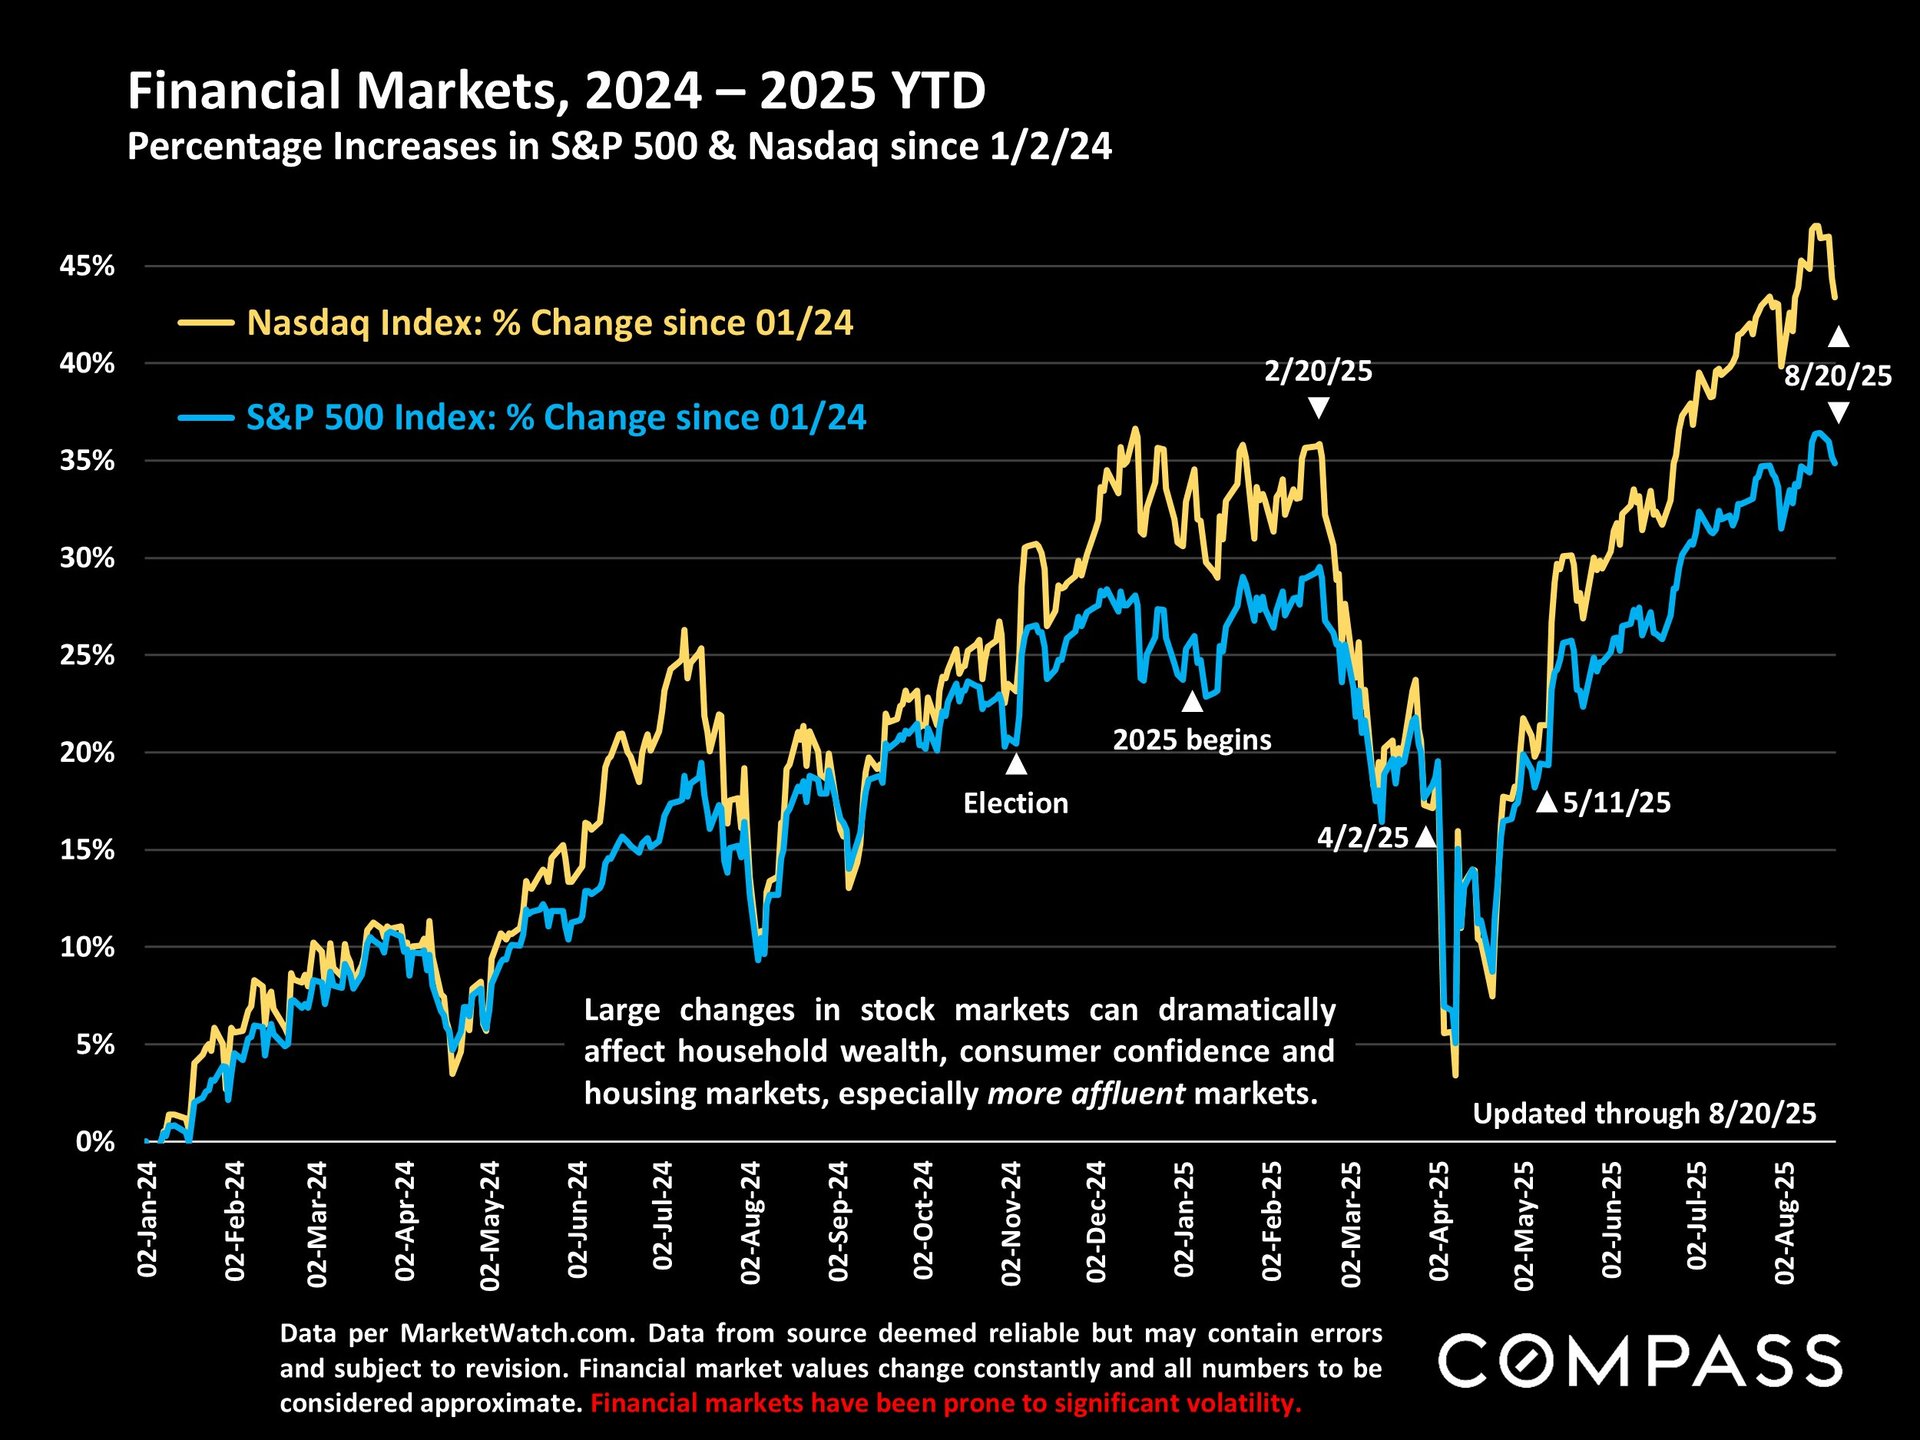
Below are 3 charts pertaining to economic indicators discussed in this report.